Following our free August 15 webinar on “Future-Proofing IT Landscapes with the Data-Driven LeanIX Visualizer”, here's some additional background to the core topics of the discussion:
- Why the LeanIX Data Flow and Free Drawing Visualizer is needed by Enterprise Architects—and how it can be used to improve reports;
- The value of cross-organizational collaboration when performing Integration Architecture and mapping data flows in enterprise-size environments; and
- Why ad-hoc visualizations are necessary for modern Enterprise Architects.
Evaluating IT modernization projects from a business standpoint is difficult when organizations rush forward without a holistic overview of their application network. Effective or not, the prevailing “rip-and-replace” method for upgrading trusted yet inflexible applications is fundamentally about speed—a high-stakes gamble whereupon target architectures get pursued even as their assessments remain in progress.
This trend won’t end in the near future. Though Forrester predicts a 25% minority of organizations might limit digital transformation efforts to only pragmatic and “surgical” upgrades, Enterprise Architects must routinely get answers to the following without delaying business:
- How will switching applications affect corresponding technologies and their user groups?
- What’s the technical and functional value of a new application? Is it significantly higher than what’s used currently? Do other applications provide similar/better functionality?
- How well is staff trained to use the application?
- Would re-architecting the application be more beneficial?
- What’s the service lifecycle of the new application—and will these lifecycle stages be included within an overall IT roadmap?
Doing so requires a clear line of sight into IT landscapes and the intricate ways all applications interlink. Without this transparency, or a collaborative platform that leverages the support of colleagues and gives them a place to review materials, enterprise-grade modernization strategies will not meet deadlines (or, at the very least, turn out as desired).
Complicating matters, however, is the fact that most organizations are flooded in IT complexity (as confirmed by 76% of 800 global CIOs polled in a 2018 independent global study by Dynatrace) and can’t execute on new architectures without a high degree of manual effort. It's a problem that can very often be sourced to the use of generic tools for inventorying and analyzing IT landscapes like Microsoft’s Excel, PowerPoint and Visio—each brilliant in many ways, but none a dedicated mechanism for qualifying application data and contextualizing IT solutions.
You know, the things that help when planning irreversible changes on an organization’s infrastructure.
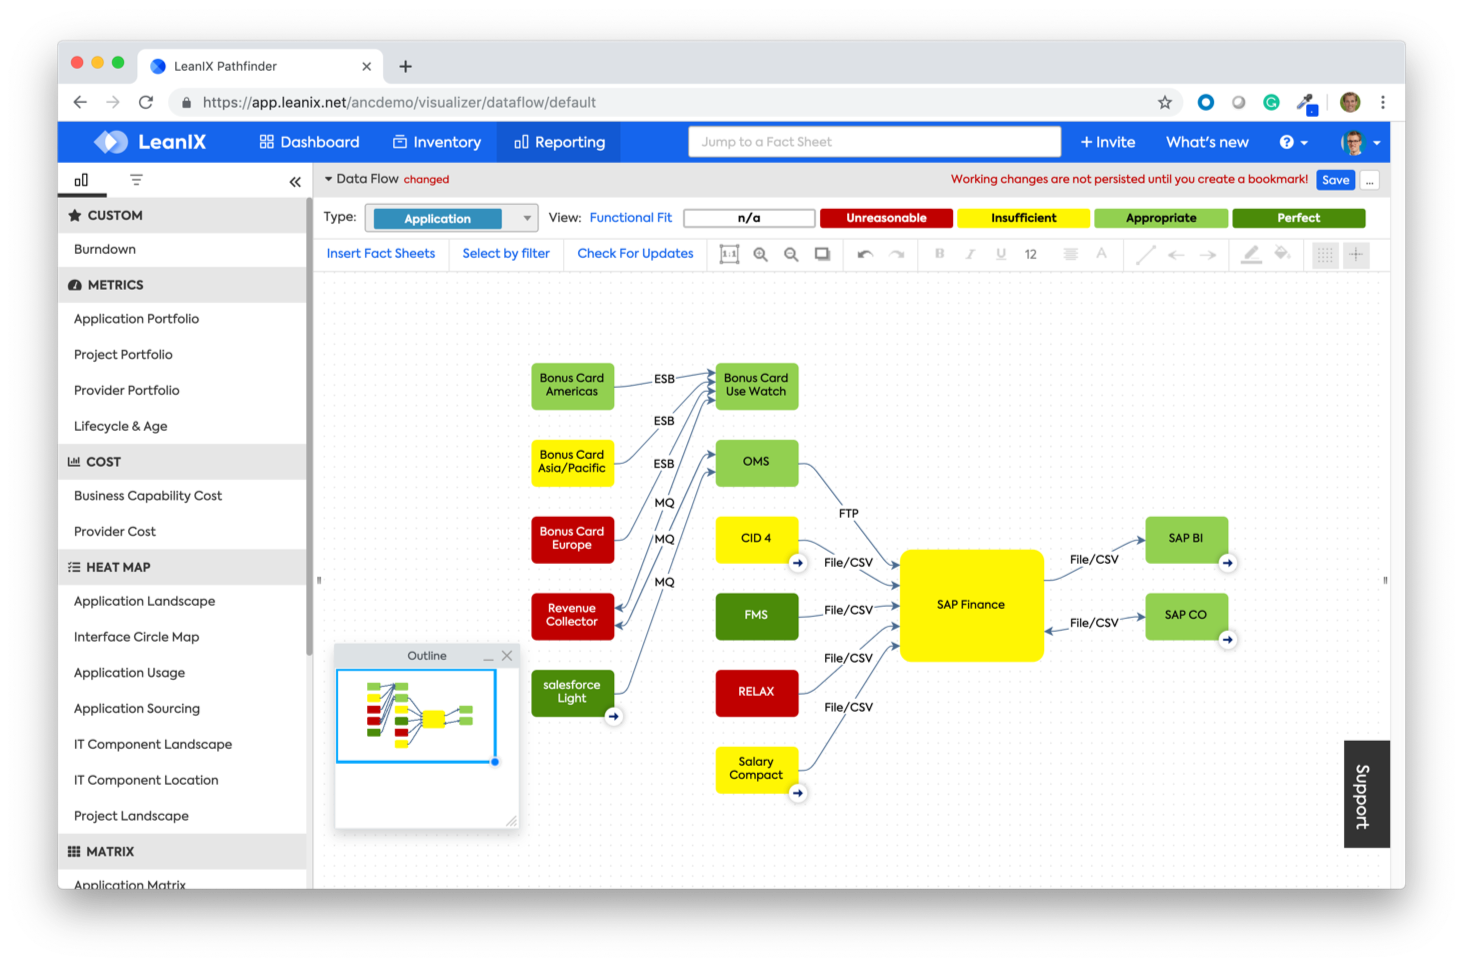
The LeanIX Visualizer, on the other hand, is a built-in report in the Enterprise Architecture Management tool that automates application and interface modeling with information stored in IT inventories. Data integrity is guaranteed by smart, system-based workflow mechanisms, and the result is an interactive and color-coded approach to seeing where, when at which frequency information is exchanged throughout an enterprise.
Of note, the Visualizer lets users interactively workshop issues found in other LeanIX reports to contribute the following to modernization efforts:
Faster roll-out times
LeanIX Visualizers can be toggled to show data flows and application models in terms of service lifecycles, business criticality and technical/functional fit. The benefit is direct insight on obstacles hindering application roll-outs.
Accessible overviews of business impact
In addition to built-in analytics reports on application interfaces, APIs and integration platforms, LeanIX Visualizers bookend a series of comprehensive options for dissecting IT landscapes to address enterprise matters such as impact analysis and dependancies. But just as important, this end-to-end visibility can occur at speeds that reflect the pressures of a scaling business.
Qualified data
Not only are LeanIX users (and there’s no limit, by the way, on how many an enterprise is permitted) able to contribute data to the central repository, each is entrusted to routinely verify the accuracy of information provided—a system designed to expedite knowledge gathering and thereby reinforce architectural planning. It’s all regulated by a variety of quality control mechanisms, but if information is discovered to be inadequate/incomplete at the time of modeling, alerts can be distributed to retrieve whatever is missing.
Reduced complexity, increased visibility
The Visualizer is how Enterprise Architects profit from perfect visibility into all current, planned or inactive applications in an IT landscape. Whether previewing target architectures or adjusting current arrangements, IT modeling done through the tool is a way to efficiently unravel complexity to prepare for incoming innovations.
All of this will be explained in great detail by Johannes, but if you can't wait until August 15, take a look at some previous blog posts on the Visualizer (here and here).
[LeanIX's free webinar: "Future-Proofing IT Landscapes With Data-Driven LeanIX Visualizers"]
LeanIX offers a Software-as-a-Service (SaaS) for Enterprise Architecture (EA) that enables organizations to make faster, data-driven decisions for their IT landscape. More than 180 worldwide brands such as DHL, Merck, Vodafone and Zalando use the innovative tool. Users of LeanIX gain insights on how to organize and leverage their IT landscape to increase competitiveness and innovation going forward. LeanIX addresses the common enterprise predicament that information regarding IT landscapes is missing, outdated or difficult to analyze. LeanIX's central office is in Bonn, Germany.