
In a previous post, we reported the challenges for successful IT integration following a merger. In this post, we continue the five-step approach to consolidate IT landscapes. The previous post also detailed how companies organize applications to user groups and business capabilities, which makes it possible to assess redundancies and gaps in IT support in both dimensions.
This article continues with steps 2-3 of the Five-step approach to consolidate IT landscapes. For step one, please refer to the previous post.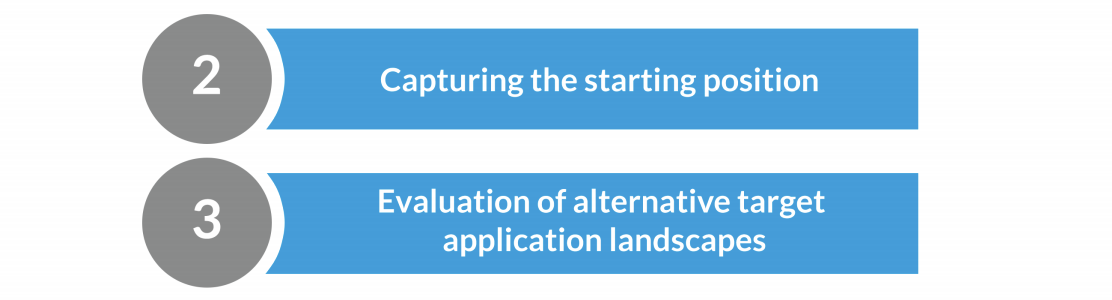
2. RECORDING THE INITIAL STATE OF THE IT LANDSCAPES
If there was no central IT repository within the company before the M&A process, or it was only accessible to experts, it is now essential to create one. Agile project teams need fast and easy access to information about the IT landscape. An M&A transaction affects a wide range of areas in the IT landscape: Business Capabilities, processes, user groups, suppliers, data, interfaces, and technologies. And all of these twice, for both of the companies involved.
The repository must meet the standard of a “single source of truth” and be able to answer, among other things, the following questions:
- Where are which master data stored, and which are the systems that manage them?
- What systems of record do the companies have, and from which source systems do they receive their data?
- What integrations with customer systems exist?
- Which control systems use which data?
- What are the relevant locations of the data centers, and which user groups do they support?
A question you will have to answer early on is whether you want to represent the two IT landscapes in a single, joint repository or in two separate repositories. The aim, especially in our example of a merger of equals, is to have one common repository in the end. If you start out with two repositories, you will have to combine them later.
3. EVALUATING ALTERNATIVE TARGET APPLICATION LANDSCAPES
There are four main strategies for defining a target application landscape, and the quality of an application landscape has to be evaluated in its entirety. Other potential synergies (e.g., infrastructure and operations) have been excluded from our analysis.
Absorption
Absorption is the exact opposite of co-existence. There are clear differences in quality and cost between the two application landscapes, so one of the two application landscapes is chosen as a target. The other application landscape is gradually phased out and replaced by the target landscape.
Co-existence
The existing business areas will continue to exist alongside each other; therefore specialist IT support remains largely unchanged. Here, the focus is on process and data integration; sourcing and IT processes can be unified. Bridges to the purchasing organization’s IT are built where they are absolutely necessary, e.g., for financial reporting.
Cherry-picking
There is a clear aim of arriving at an integrated application landscape, as both application landscapes have clear advantages, but also disadvantages. Here, decisions will have to be made individually at the application and data level in order to choose the “winning” applications.
Renewal
All core systems are newly developed, and both application landscapes are migrated to a proposed target application landscape. The image below gives an overview of the various options and their core characteristics.
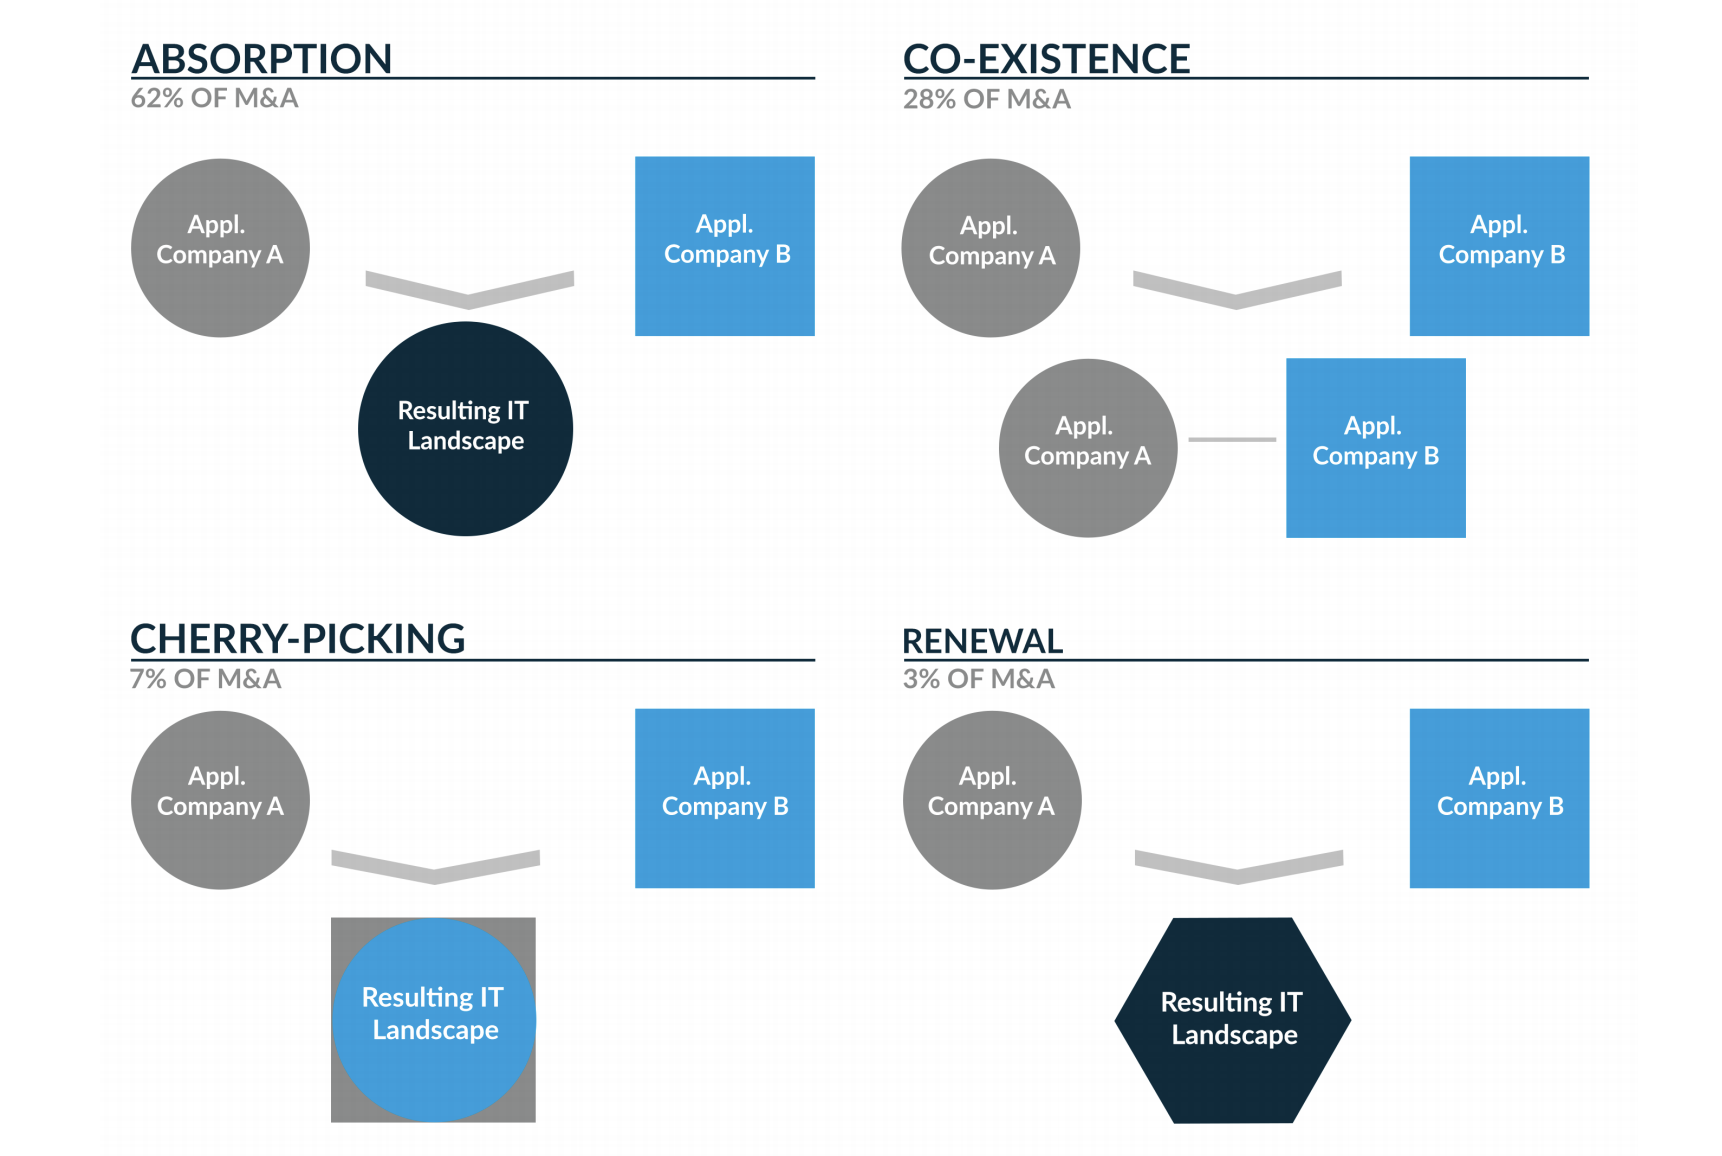
Figure 2: “Alternative target landscapes scenarios in a merger.”
Evaluating the strategies
The following considerations may help evaluate the strategies: Determination of functional redundancy What form does this redundancy take? Is there an application landscape that covers more functionality?
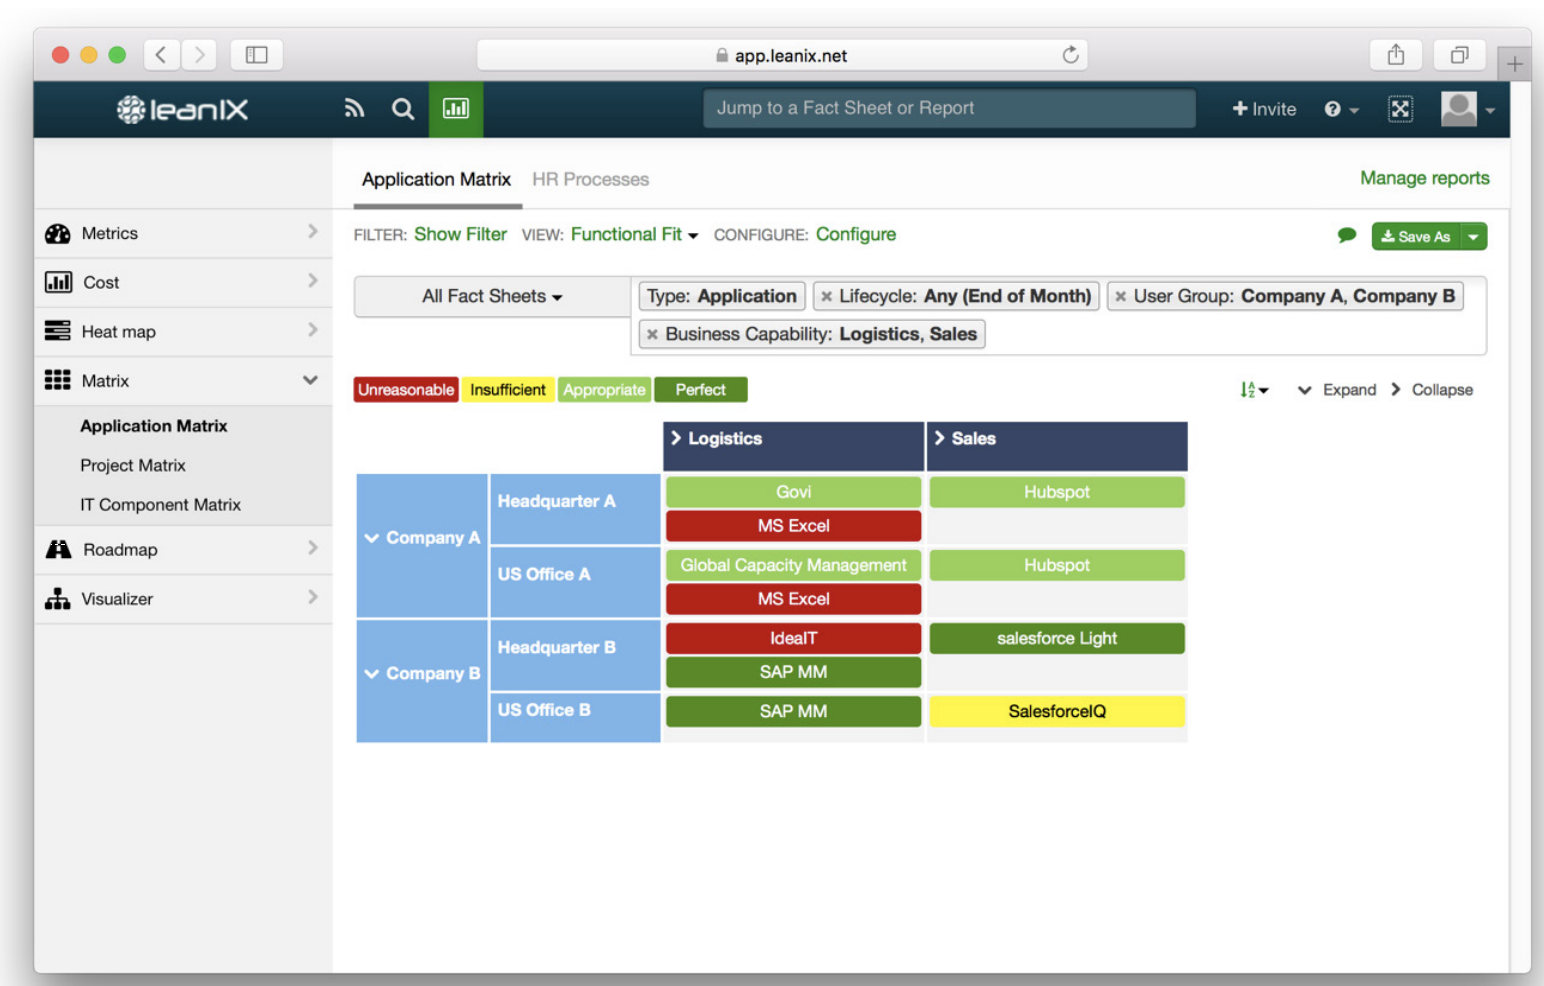
Figure 3: “LeanIX Application Matrix”
Functional and technical fit
How “healthy” is the entire application portfolio in terms of its ratings in the functionality and technology dimensions? You can, for example, limit this to only the strategically relevant functionalities.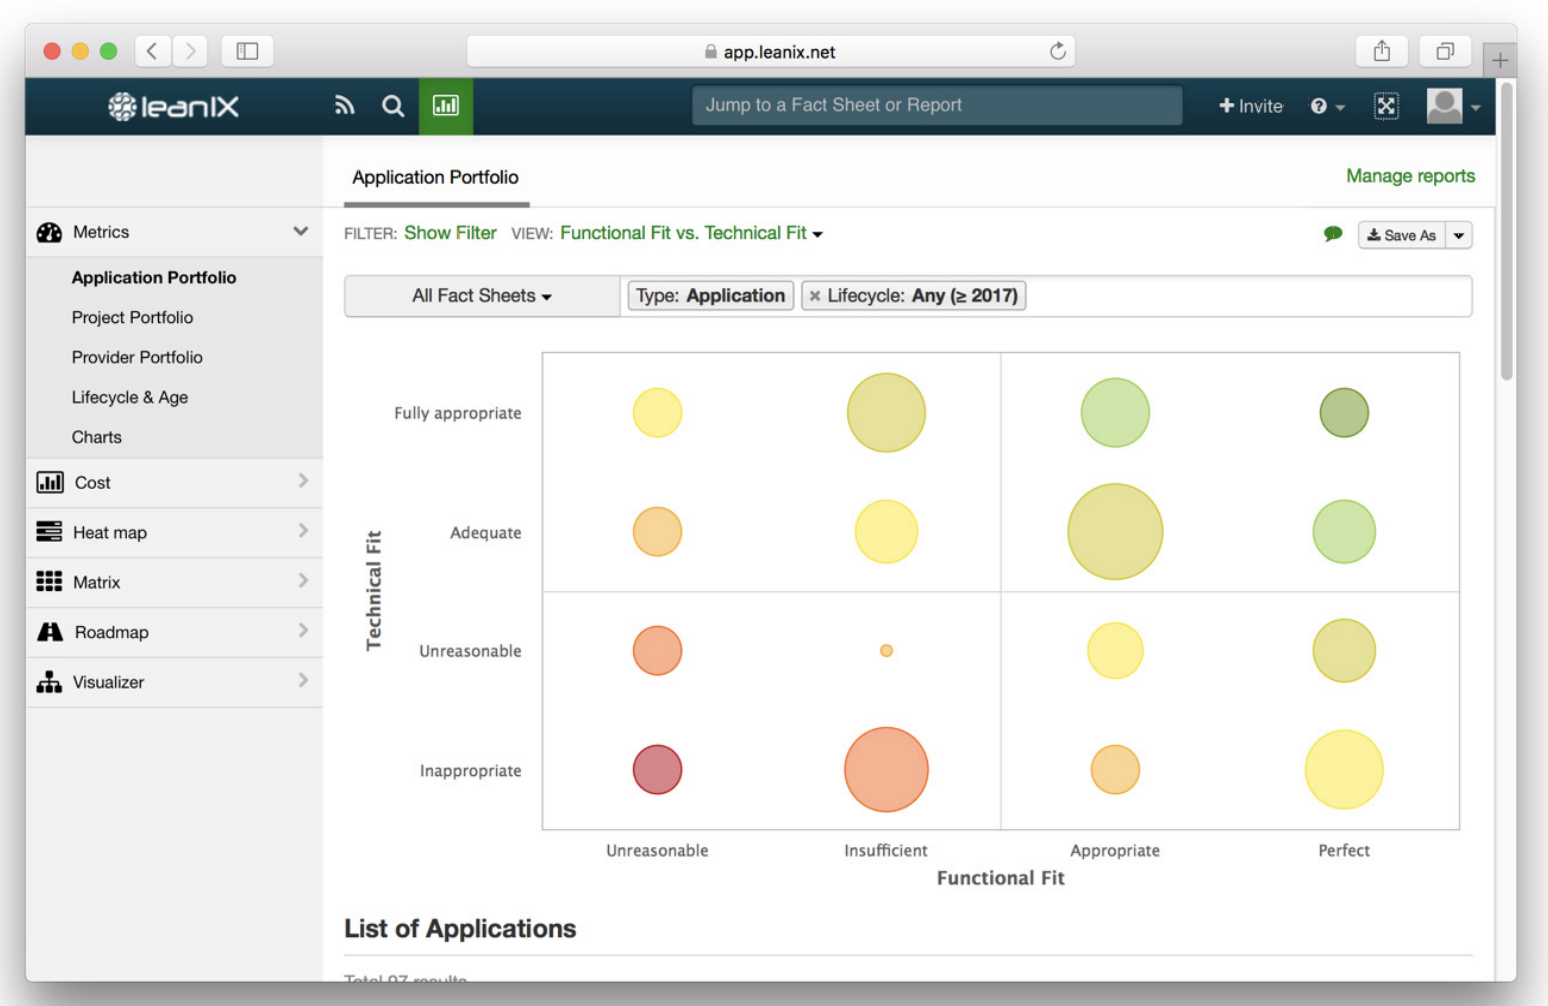
Figure 4: “LeanIX Application Portfolio”
Calculating a value score per portfolio
In this example, you could calculate one average value per dimension for each company. The number of application systems is converted into one value for functionality and one value for technology per category in each dimension. These values are then converted into a total value per portfolio.
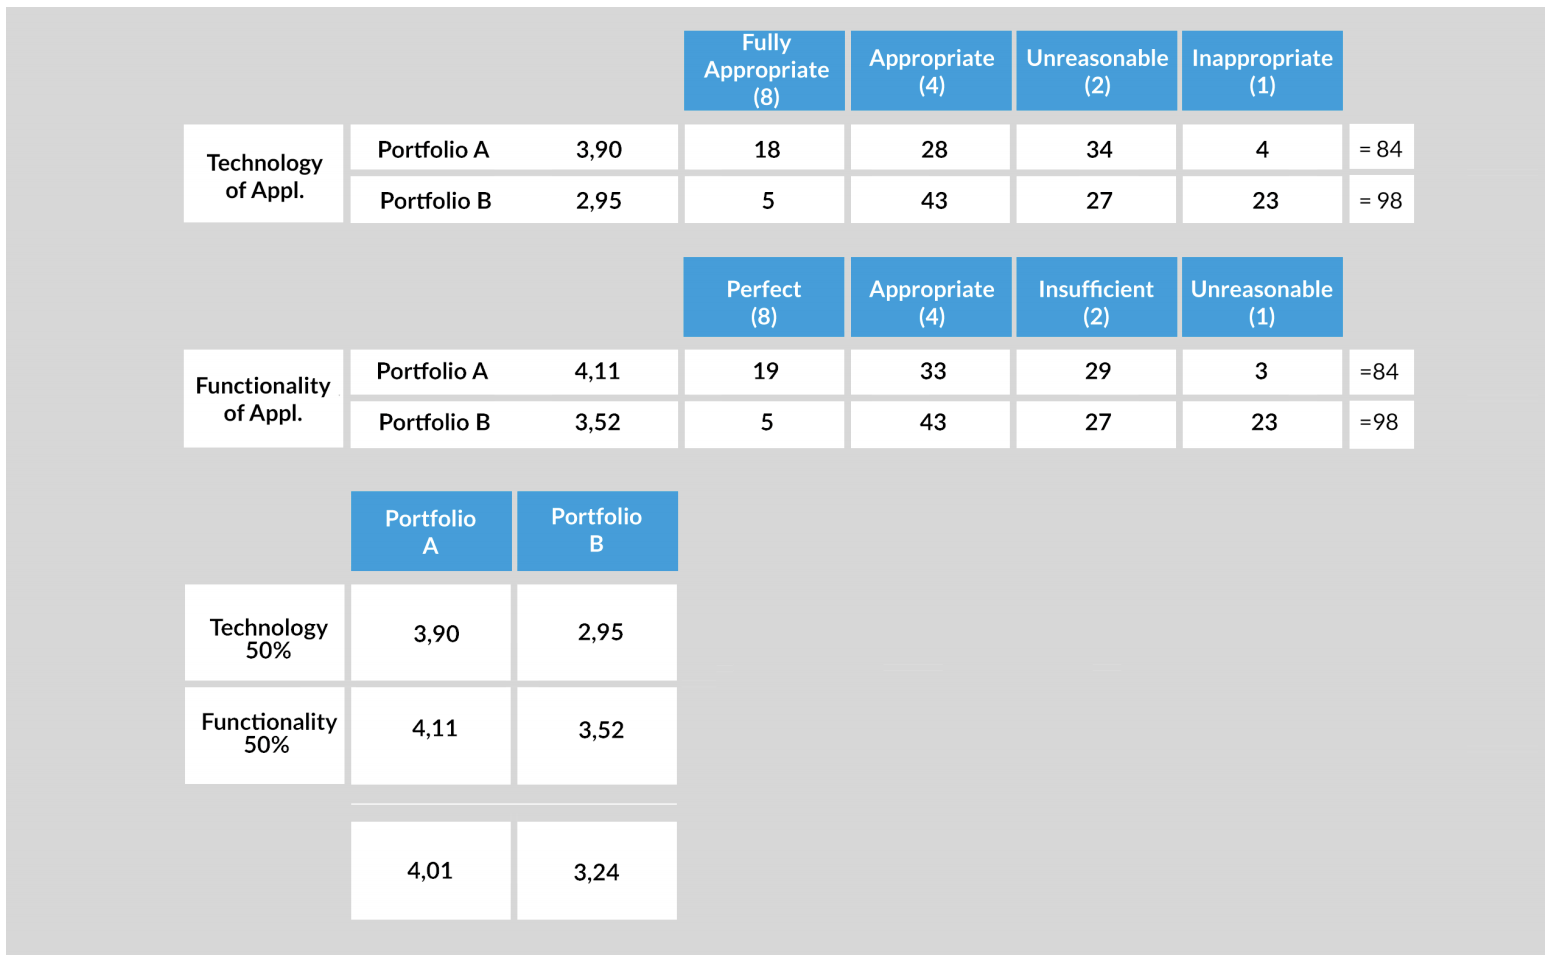
Figure 5: “Example of how to calculate which portfolio has a better overall value.”
The following distinctions can be used to define the functionality of applications:
• Unsuitable: Insufficient or incorrect functionality (weighting: 1)
• Inappropriate: Rudimentary functional support (weighting: 2)
• Appropriate: All main functionalities (weighting: 4)
• Perfect: High number of functionalities (weighting: 8)
For the level of technical suitability we suggest the following criteria:
• Unsuitable: Needs to be replaced to meet business requirements (weighting: 1)
• Inappropriate: Should be replaced to meet business requirements (weighting: 2)
• Appropriate: Some areas have potential for optimization (weighting: 4)
• Perfect: No changes required beyond normal maintenance (weighting: 8)
A simple example: The values for the technology and functionality of the two portfolios in the example are weighted at 50% each. In this example, portfolio A thus has an overall better total value. If you choose a strategy in which you select one main landscape and absorb the other, you would select portfolio A as the main landscape here.
Rating individual applications (BeyerSmertnig model)
For this example, we assume that there is a high redundancy between the portfolios in general, as the companies have similar business models and thus similar business capabilities.
Now the challenge is to select the respective target applications. Due in part to a lack of knowledge of the other party’s application landscape, each organization is probably convinced that its own applications are superior. A process that is as objective as possible and focuses on business support will, therefore, be helpful. The cherry-picking strategy aims to combine the strengths of the two initial companies. This means that if there are multiple alternatives for an application, the best will be selected. Experience shows that it is best to begin this assessment with applications for the most important business capabilities, as this allows conclusions for the systems of record to be derived.
All considerations are based on being able to arrive at a statement regarding the functional coverage and adequacy of a company’s entire application landscape within a very short time span (one to two weeks). Many models used in practice seem very complex, not truly target-oriented, too subjective because they rate “soft” factors, or to require very complex analyses to create. We aim to conduct an assessment of an existing situation that will allow a consensus or make the two different objects comparable with as few “tangible” attributes as possible.
It has repeatedly become apparent in practice that comparability is a fundamental requirement for decision-making. This statement may seem banal; however, most attempts to reach a decision fail because the two objects being compared are not designed in a sufficiently comparable way. We, therefore, present the Beyer-Smertnig model, which optimally supports these goals. The model was co-developed by LeanIX co-founder Jörg Beyer in his time as CIO and successfully employed in several IT integrations.
We apply this model to the functional suitability of all IT applications. All the main functionalities of the applications should be listed. You can use the existing function names; it is not strictly necessary to align the terms. These lists serve as the basis of the assessment. Here too, assessments are made in two dimensions: support and criticality. Simplified, this assessment takes the following form:
Criticality:
-2: not relevant to success
0: obligatory
2: critical to success
Support:
-2: not supported
0: standard support
2: excellently implemented with no need for change
Intermediate values of 1 and -1 can also be used.
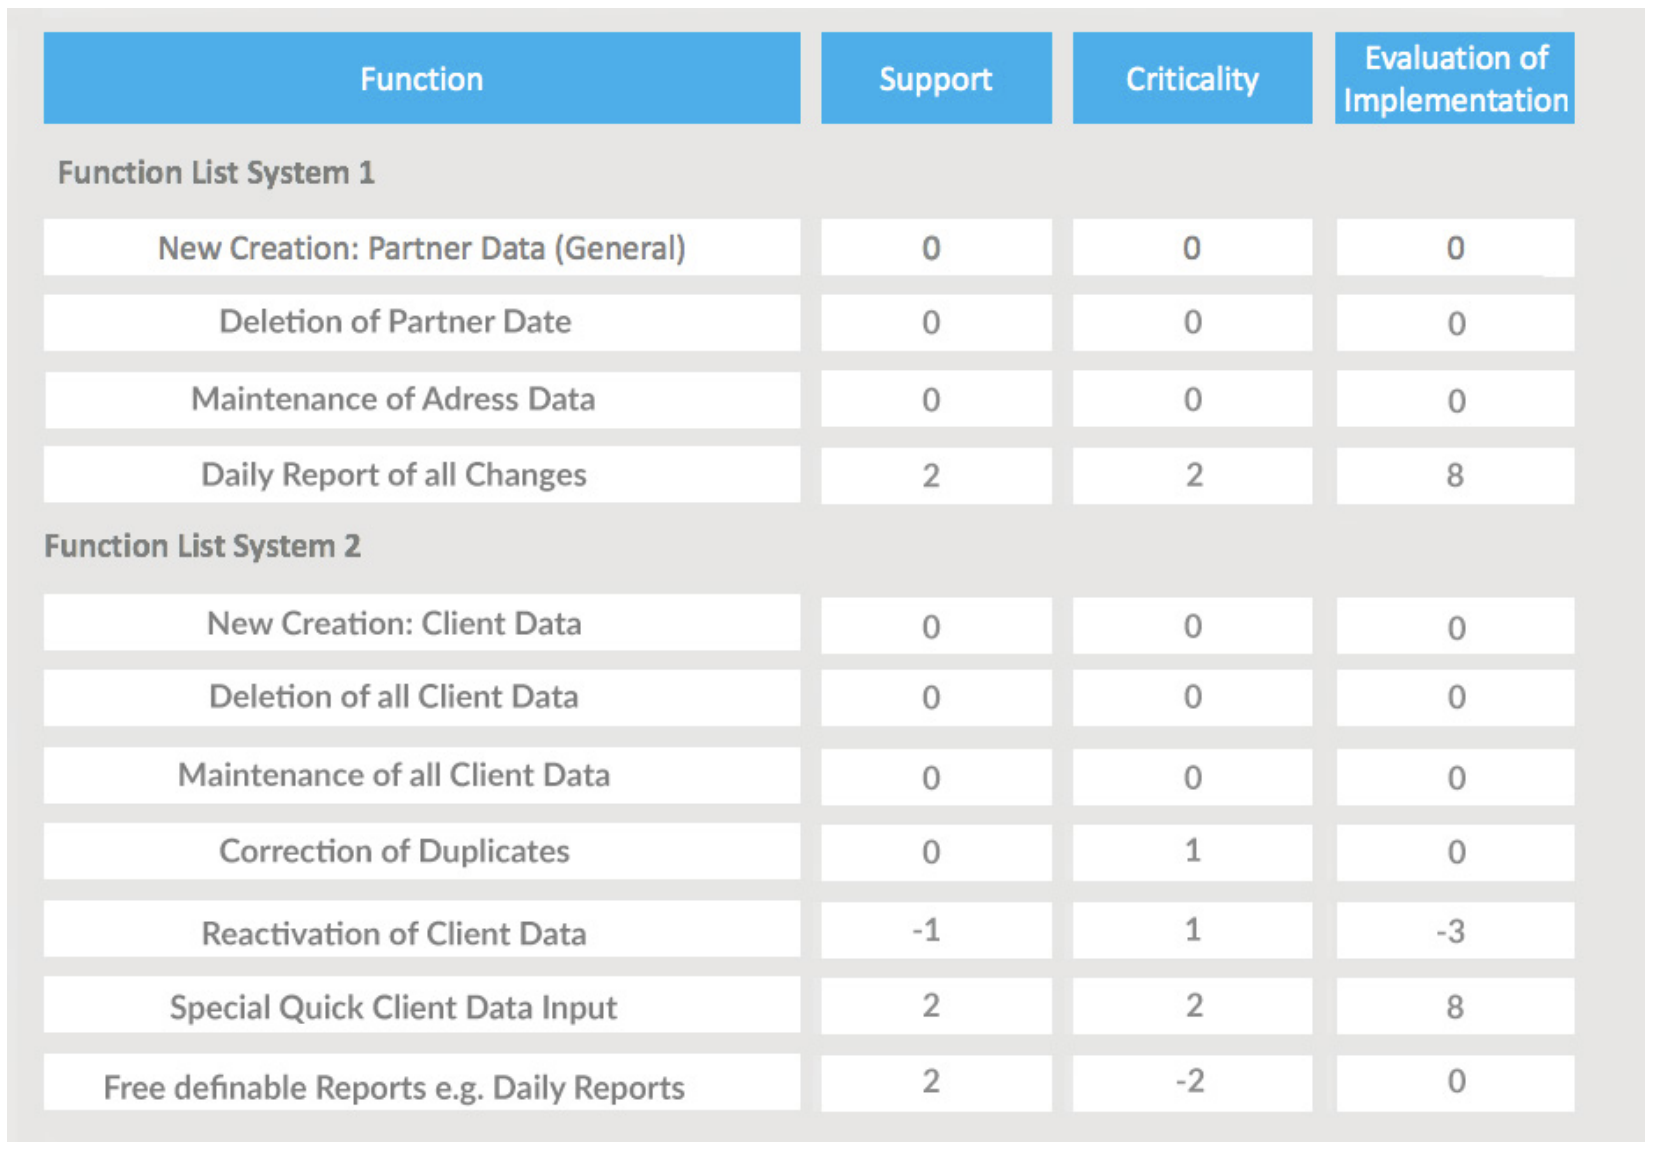
Figure 6: “An example of rating through cherry-picking.”
A decision for or against an IT application should be made as far as possible using differentiating characteristics—both negative and positive. The numeric values of zero are therefore very important, as they ensure that obligatory functions are neutrally rated. It is assumed that the superiority of an IT application manifests in its success-critical functions. The second value is therefore the respective level of support.
The value of the Beyer-Smertnig model lies in identifying what is necessary and good. Over time, large numbers of obsolete functions tend to build up in IT applications. Merely analyzing the functionalities is therefore insufficient; their implementation must also be assessed. Is this a useful function? If so, is it well implemented? The simple formula
application rating = support * (criticality + 2)
delivers the result values. What looks so insignificant is in fact very powerful. Important functions that have been inadequately implemented are badly rated. The same applies to insignificant functions that have been excellently implemented. Unnecessary items are thus downrated.
Underlying this formula is the simple assessment that insignificant functions can be neutrally rated zero, regardless of their support, whereas inadequate implementations of highly significant functions are rated very negatively.
This means there are penalty points for implementing functions that are not critical to success. This also helps cut down on source code that would otherwise have to be needlessly maintained, reducing the complexity of an application and enabling greater flexibility in its further development.
The limit range is -8 to 8. In fig. 11 you can see that the fast “Special Quick Client Data Input” form receives a high rating thanks to its excellent support and high significance. To fully assess both system functionalities, first calculate the average value.
System 1 = 8/4 = 2
System 2 = 5/7 = 0.7
This gives us a very good indication of whether one IT application is superior to another, and provides a basis for selecting a target application.
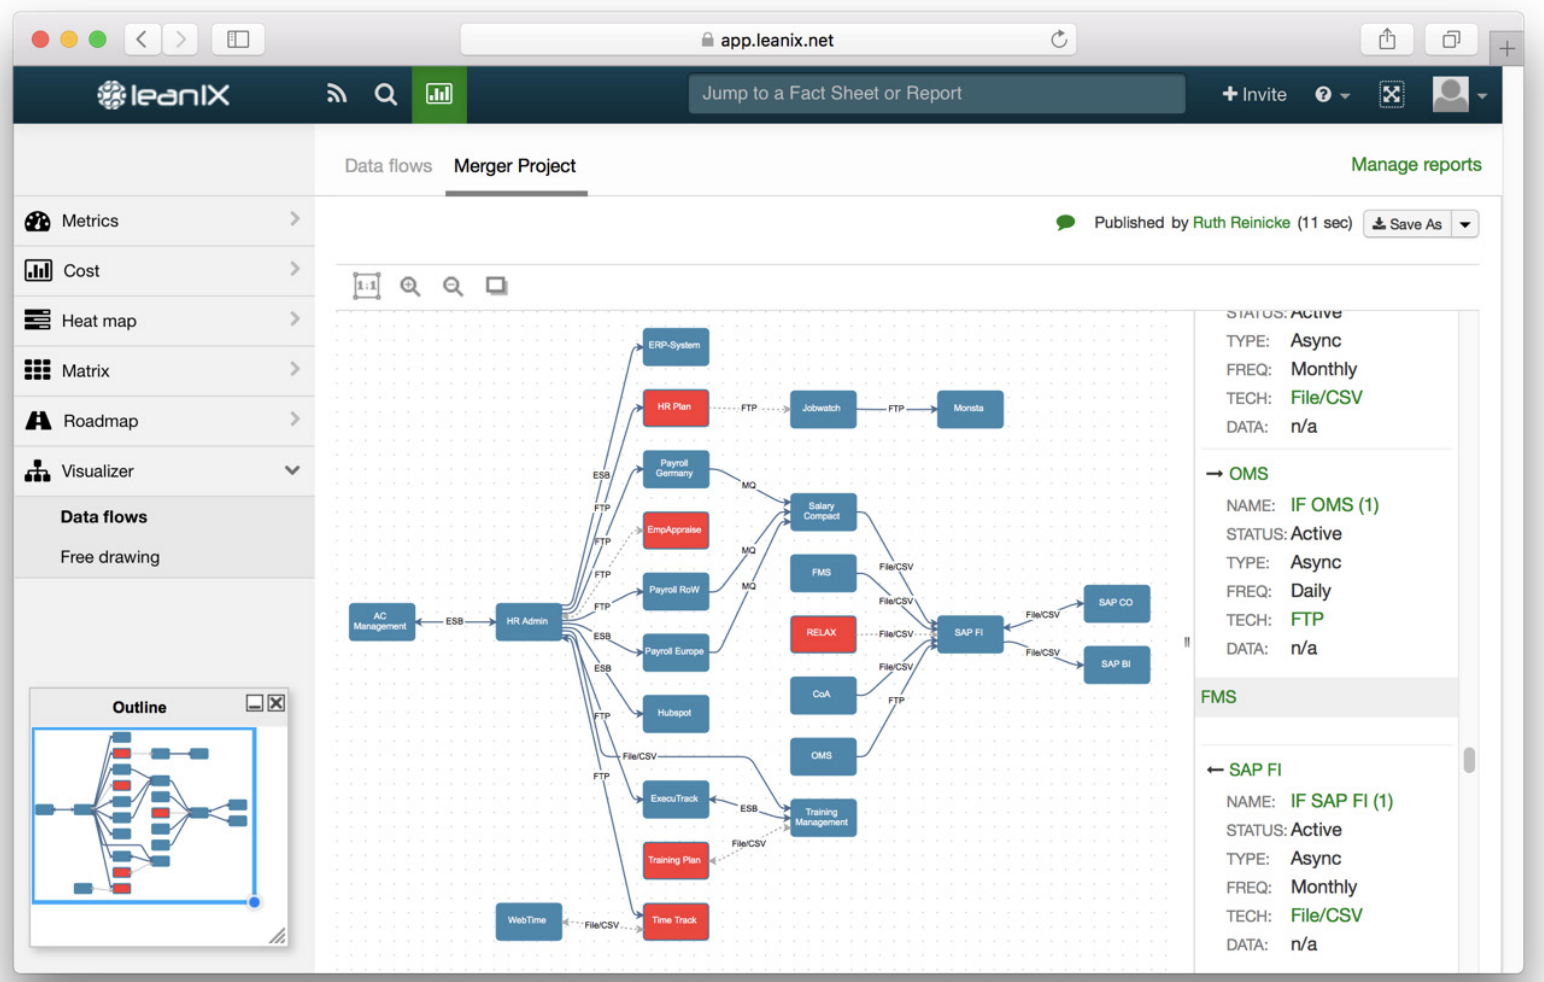
Figure 7: “Data flow modeled by applications.”
Deriving dependent applications
Once you have determined the core applications, check the applications’ dependencies. Which interfaces do they have to other applications, which data flow between them? These dependencies will affect the selection of less critical applications. You also have to consider functionalities in the context of the new post-merger business strategy: Which functions does application A support that application B does not? Also rate their quality, sustainability and flexibility. Potential savings, the feasibility of migrating them and the duration of the implementation should also be considered.
BCG advises identifying clusters of applications. Clusters are groups of applications that form relatively autonomous units due to their common technical standards and compatibility. Select the applications that form clusters with the previously identified business-critical applications, and take dependencies into account. You can then use these clusters to complete the new target landscape. Clusters can be recognized for example by means of technical components that are used by multiple applications. These dependency analyses, e.g. of a database, are easy to perform with a good EA repository. Interface technologies that combine the applications into natural clusters are a further indicator.
It makes sense to mark the applications of a certain cluster (in LeanIX via tags), perform further analyses to identify possible clusters and thus iteratively arrive at a final assignment. In the quoted merger in the banking environment, BCG formed 70 different clusters for 2,000 applications.

Stay tuned for part three for the series!


