
How to survive your first days on the job
You’ve been put in charge of integrating a billion dollar company’s IT infrastructure.
Shock and fear hasn’t subsided but you nonetheless act as if everything is cool. As if you’ve done it all before.
To no one in particular, you repeat the golden mantra of modern EA:
Reduce cost
Reduce risk
Be agile
This is what you want. This is what your company wants. And this was what you achieved in your first 100 days on the job.
*inhale* *exhale*
Days 0 - 30
It started with an assessment. As mentioned in the previous blog post, this is when you listened to stakeholders to see if their wishes could be realized in a new architecture. Thankfully their feedback was practical and consistent:
1. Are our most important applications being preserved?
2. What technology is most depended upon—and is its data being updated?
3. Where/what are our technology risks?
4. How is our data being used? Where is it coming from?
5. Are we managing our vendors responsibly?
6. How much is actually being spent on IT?
These were answers you could provide. And quite possibly, very soon. All you had to do was initiate a seismic change in your organization’s culture—from fixed, silo-based workflow tendencies to agile, collaborative mindsets. After all, in a company benefitting from a shared drive for profit and market share, why shouldn’t the best practices of all employees and their data be connected?
The fastest way to do this was with a tool—by putting something in the hands of stakeholders which made it impossible for them to regress.
So you began building an architectural roadmap around the prospect of EA Management with LeanIX, a browser-based SaaS where users can log-in anywhere to provide input on Enterprise Architecture. The application promised built-in functionality to promote agile information-sharing in traditional organizations via means such as surveys and automatically imported/cleansed data, and the more accurate and plentiful this information, the more conclusive the results of its numerous configurable reporting mechanisms.
This was your pitch. But to put it all in perspective, you invited as many people as you could into a 360-degree LeanIX demo to see for themselves how all technological risks and cost-saving IT measures could be mapped out thanks to this wonderful German-made Allheilmittel.
The LeanIX rep showed how the technical fit of applications could be evaluated (from “Inappropriate” > “Fully appropriate”) with an “Application Landscape” report…
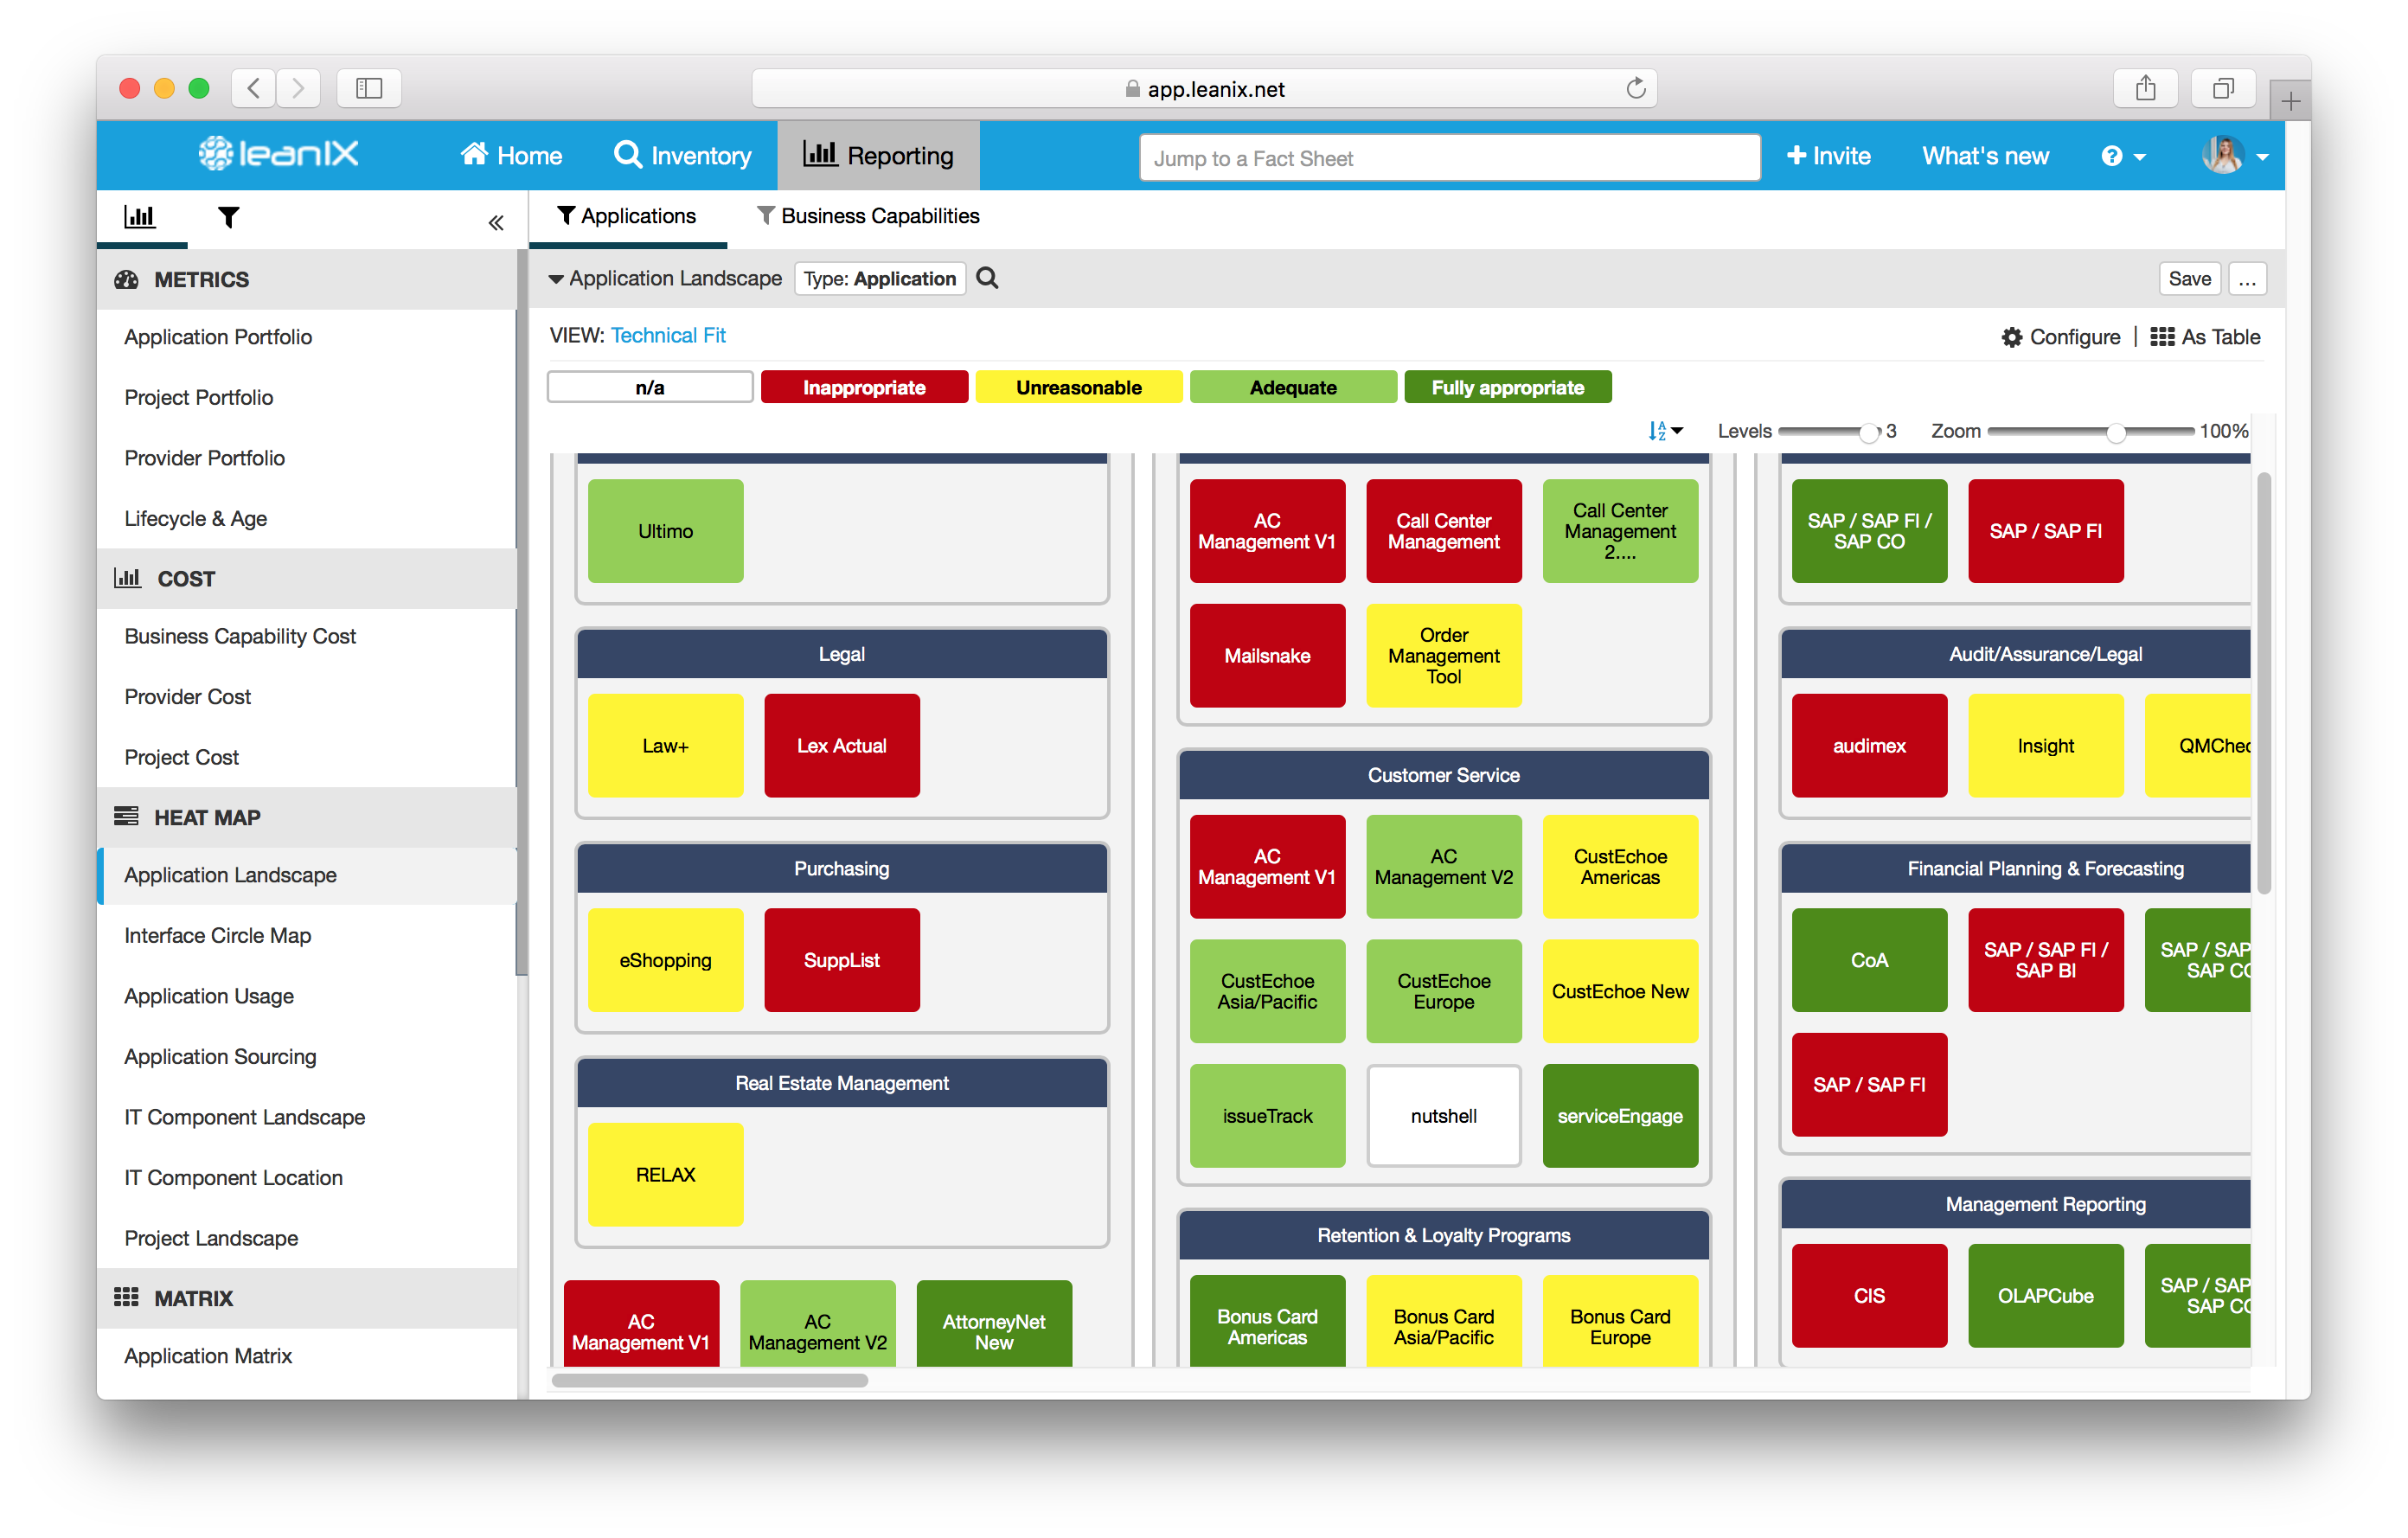
Image 1: The "Technical Fit" of applications, measured from "Inappropriate" > "Fully Appropriate", as seen in the LeanIX "Application Landscape" report.
It was demonstrated how the business capabilities and applications connected to any project could be seen by value over risk…
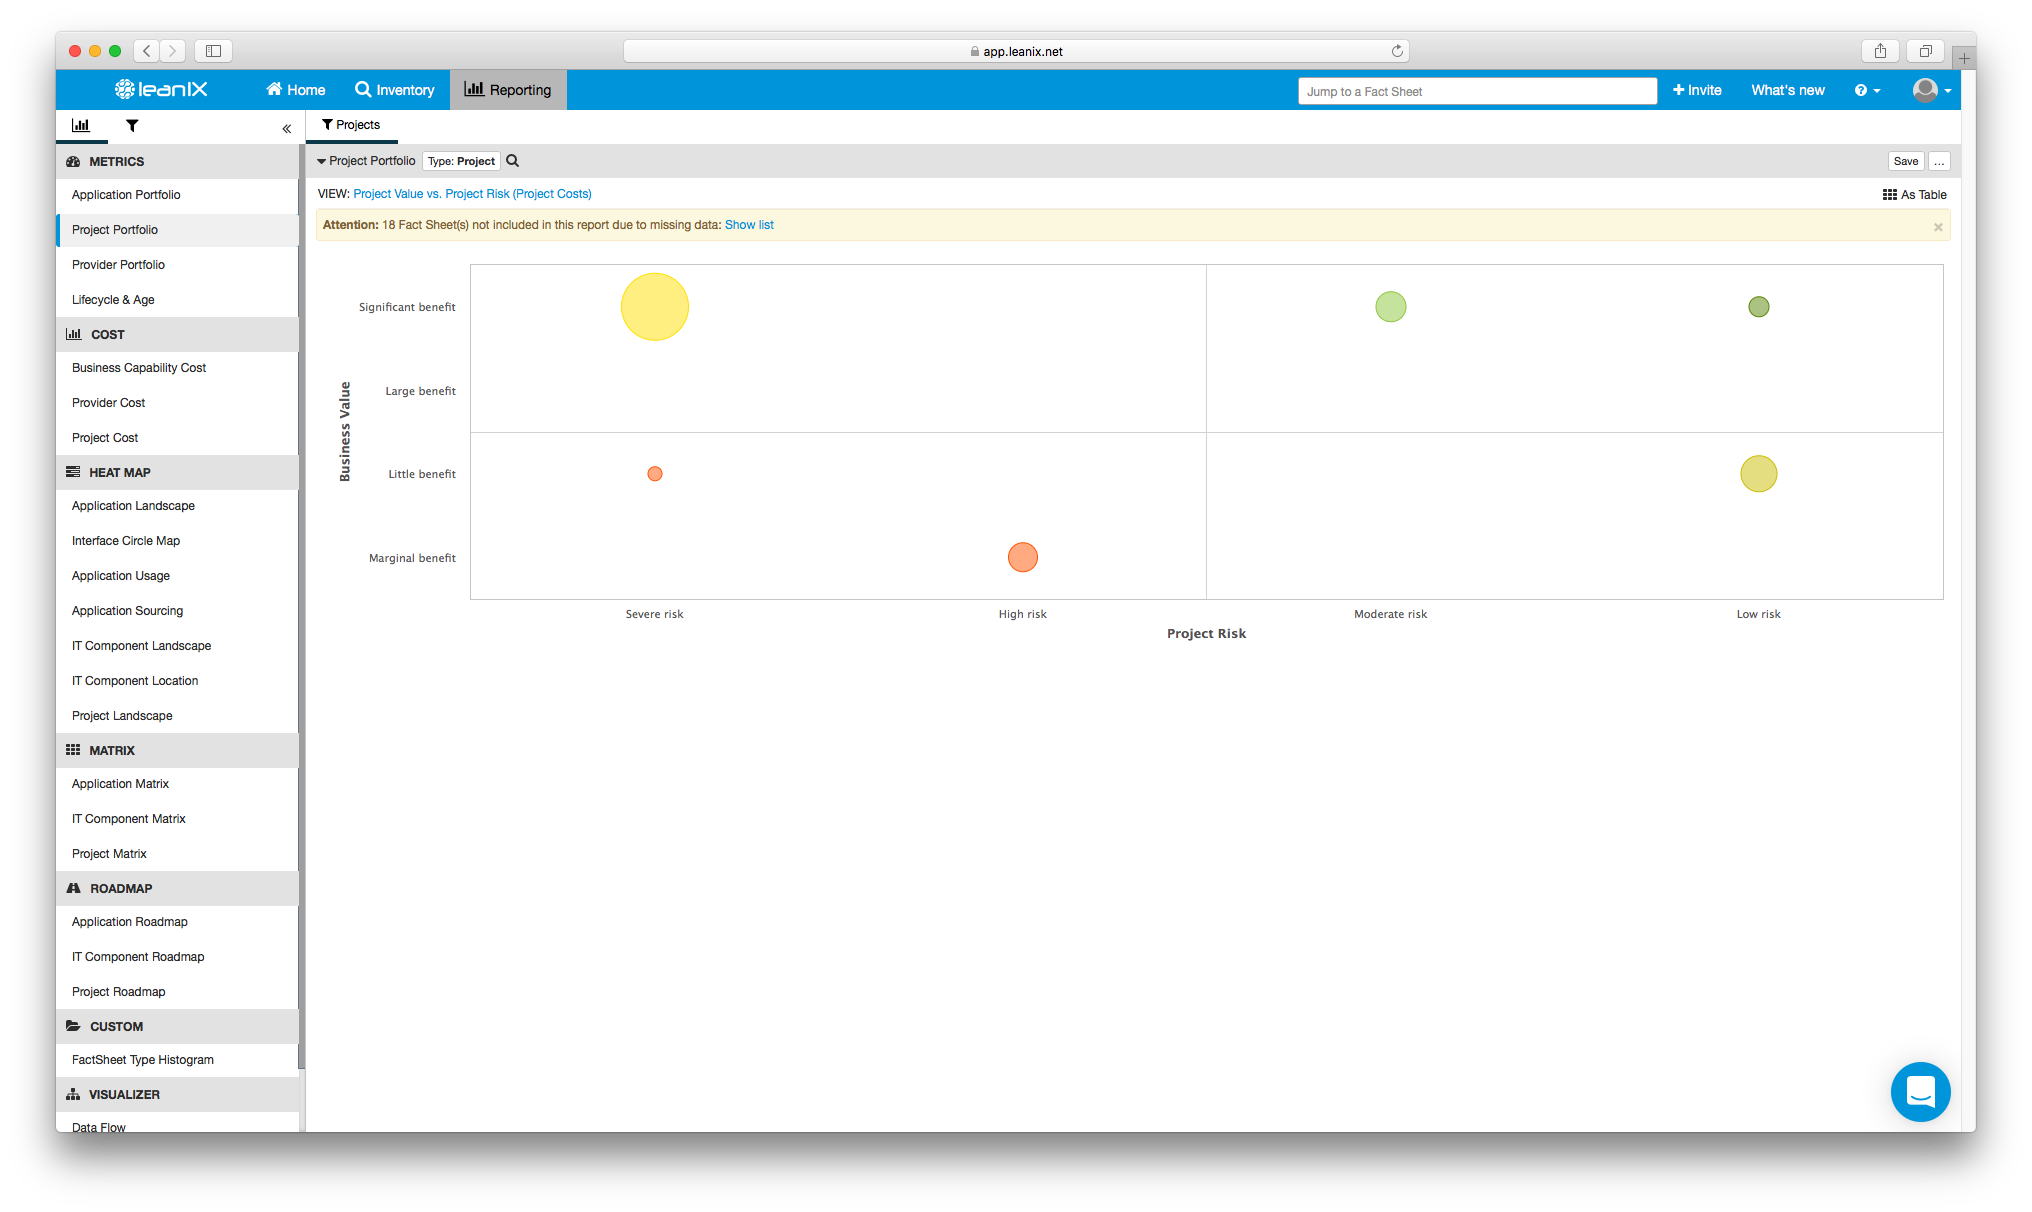
Image 2: A "Project Value vs. Projects Risk (Project Costs)" chart, as seen in the LeanIX "Project Portfolio" report.
And your team was was even taken, step-by-step, through facilitating all TOGAF planning principles using LeanIX-based functionality…
They liked what they saw. Your taciturn CIO looked your way and gave a Commodus-style thumbs up.
It was time to proceed with LeanIX.
Days 30 - 40
Everyone excluded from boardroom strategizing and live product sessions needed to be included in the gameplan. An anchor had to be put in place for your entire organization—an easily identifiable EA framework and set of processes capable of being followed and repeated on a daily basis.
You wanted regular incoming data to make your company’s architecture appear living. But most importantly, you wanted this data to thoroughly fill the template boxes of any LeanIX application “Fact Sheet”—the individual storage containers powering the synapses of the tool’s reporting network.
Here’s what a Fact Sheet looks like:
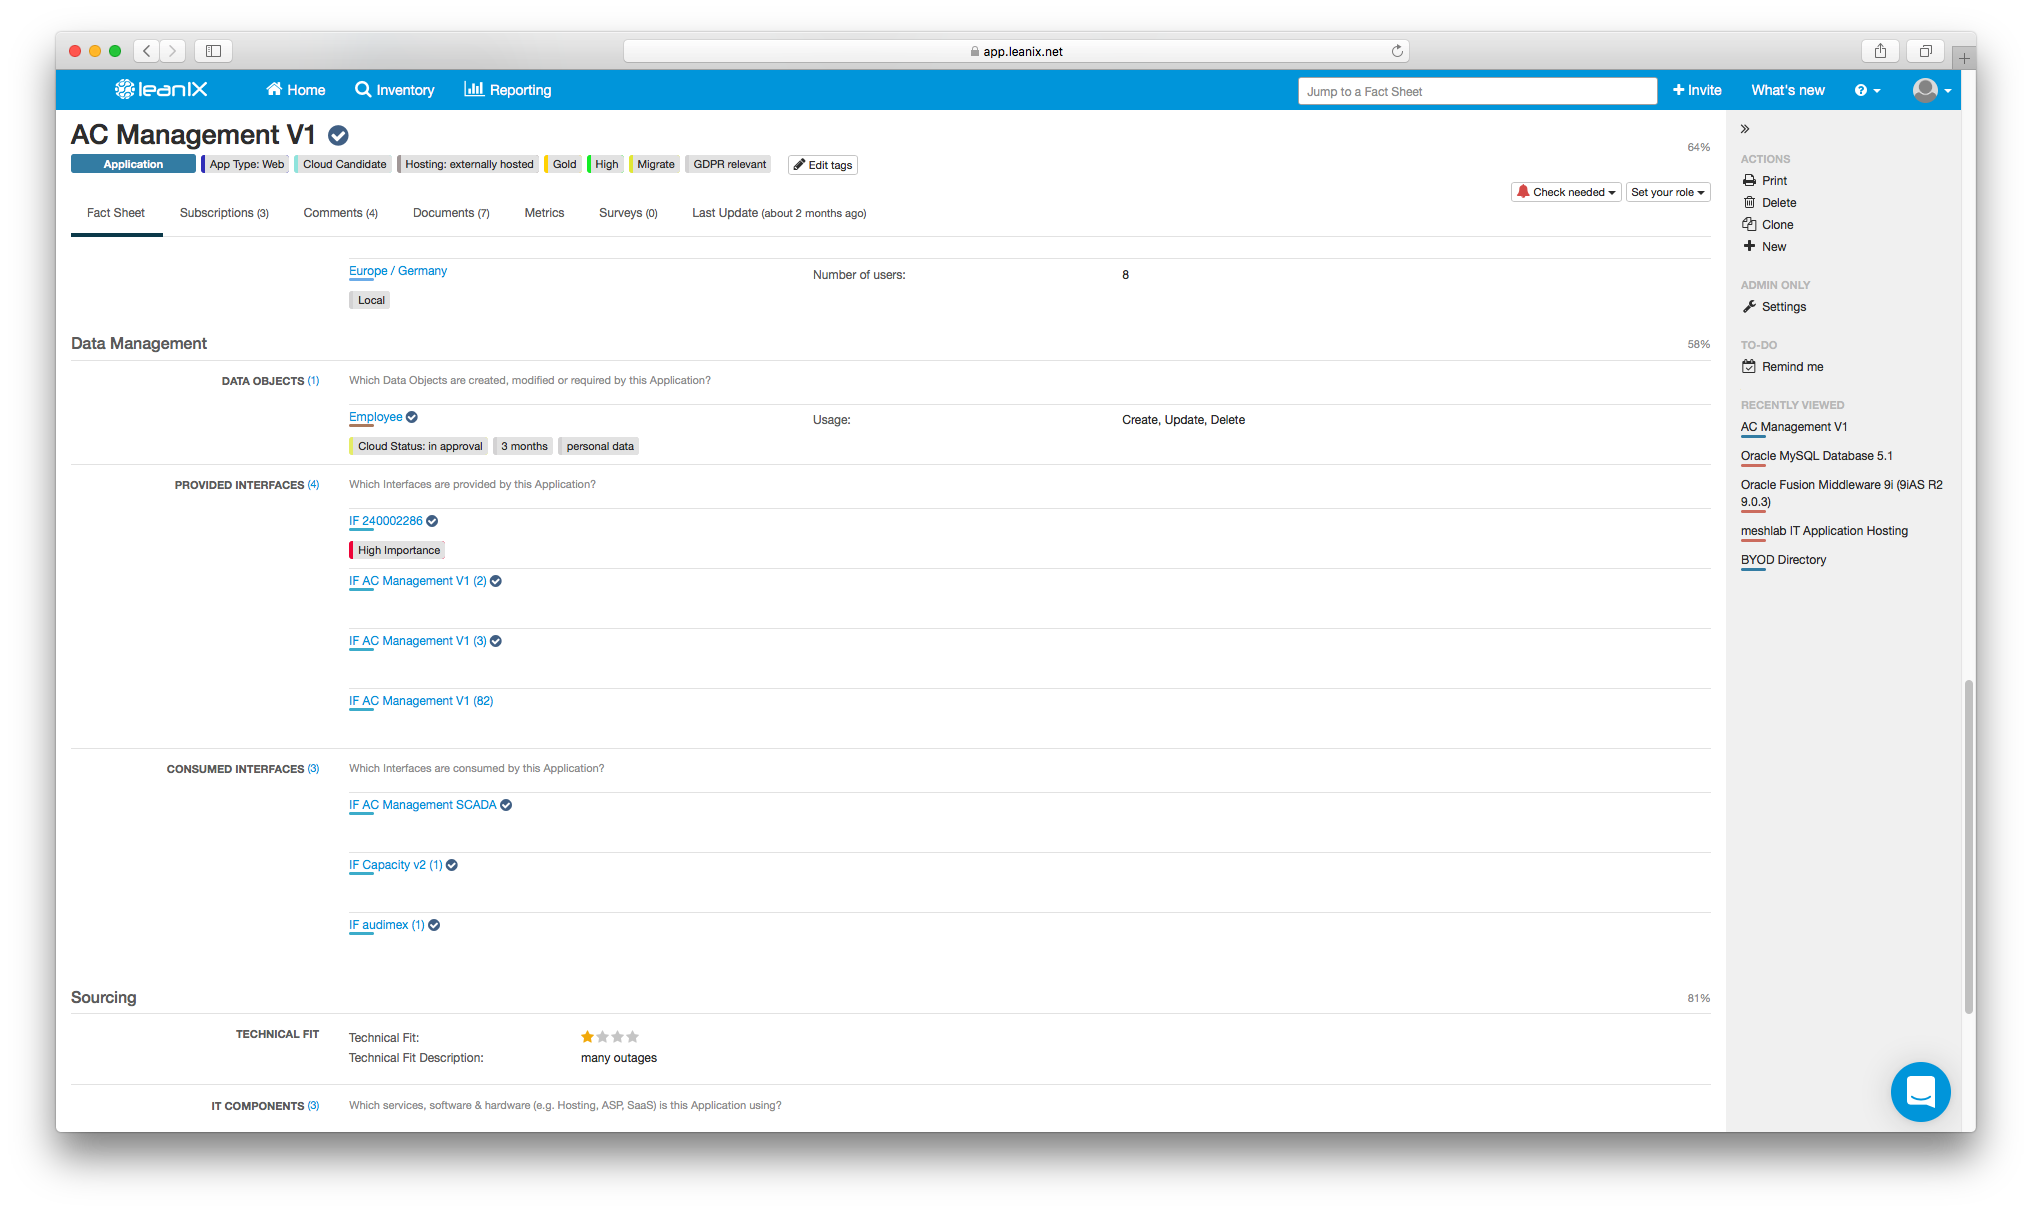
Images 3 and 4: Two views on a single Fact Sheet for application "AC Management V1" in LeanIX.
You could not monitor such data collection single-handedly, however. Though EA leaders sometimes centralize resource gathering efforts, you chose (after carefully reviewing the below chart…) to cull information across your business by assigning responsibility to various teams. Some stakeholders reporting to you; some to others. The “Hybrid” approach.
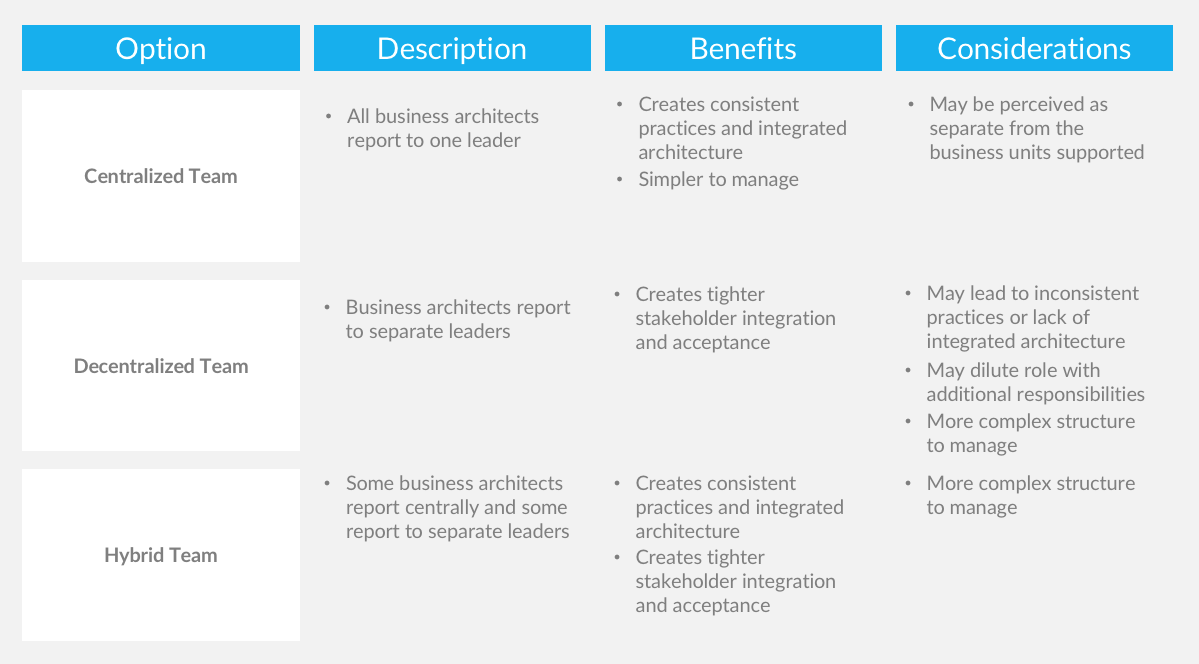
Image 5: Three ways to organize Enterprise Architecture team structures.
It was a sensible direction (especially since you’d still be the one defining the architecture and aligning it with business strategies).
Days 40 - 70
On Day 40, your personal therapist (who coincidentally has a keen awareness of EA management best practices) cautioned that too much planning with too little action was a common pitfall of next-generation EA. It was time, she said, to fly.
And so LeanIX was deployed.
Your task after the groundbreaking was simply to focus on activities with the potential to generate fast results to your company, to pave the way for the bit-sized pieces of positive reinforcement which could keep momentum growing and maintain the enthusiasm of your organization’s new EA converts.
Amassing enough reliable information about your IT landscape to execute a first wave technology cost-benefit analysis was thereby your first priority. With this basic inventory, you could then also analyze your portfolio based on business criticality to respond to two of the aforementioned EA needs from stakeholders (What technology is most depended upon—and is its data being updated? + Are our most important applications being preserved?).
Being the resident LeanIX expert, you stood by to assist everyone with migrating their data to the new tool. Everyone had the option to (1) load materials manually…
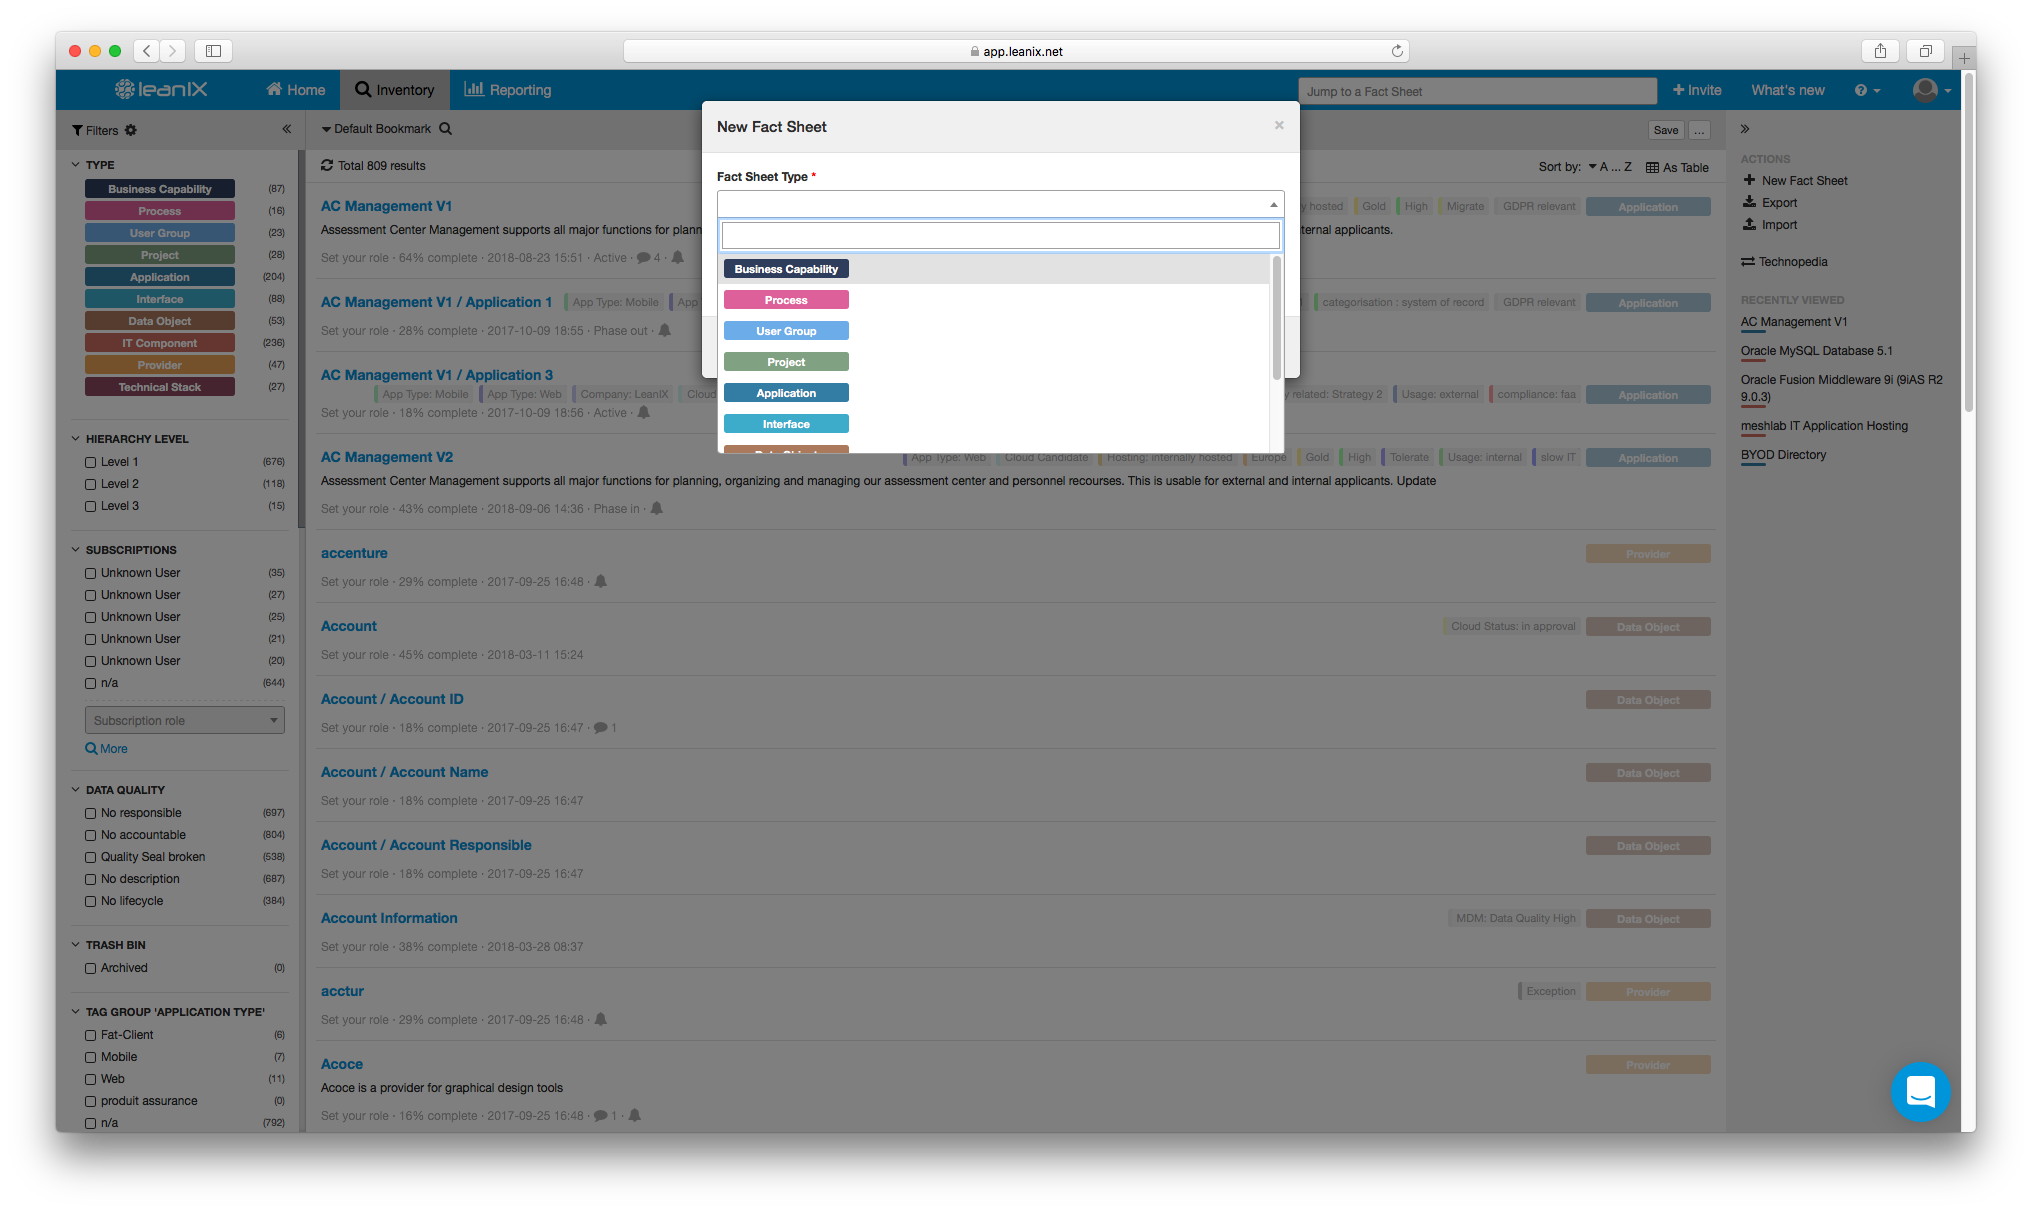
Image 6: Manually beginning a new Fact Sheet in LeanIX.
…or (2) by using Excel spreadsheet templates....
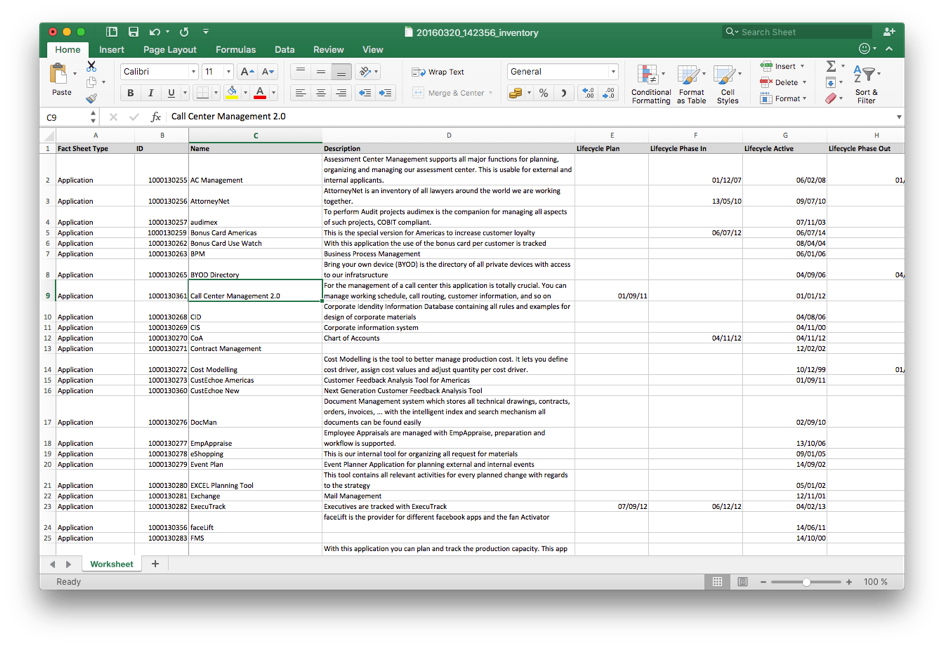
Image 7: An Excel file structured to be imported into LeanIX. In this example, unique applications are prepared according to “Fact Sheet Type”, “Name”, “Description”, and various stages of their “Lifecycle”.
…and you (3) even showed how this data could later be differentiated into specific schemas using the GraphQL integration.
It was your hope that an inventory like this would unearth enough intelligence about your applications to eventually draft a thorough Business Capability Map for your organization—an illustrative guide to the expertise and technology most relevant to the central functions of your operation.
Days 70 - 100
As planned, your inventorying efforts started to bear fruit around the 70-day mark. Much of this was a direct result of how you cleverly distributed your data hunting parties. So, after five minutes of intense self-appreciation, you finally set out to see what quick cost-saving, business-focused metrics and KPIs could be drawn up in LeanIX to justify EA to your CIO and IT Managers.
You went right away to an IT Component Matrix reporting tool to appraise your core services, software, and hardware (i.e., the tech with hefty provider fees and costs per application). Selecting a view based on “Total annual cost” as separated by “Database”, “Middleware”, and “Operation”, it was time to see the data in action.
This is what appeared:
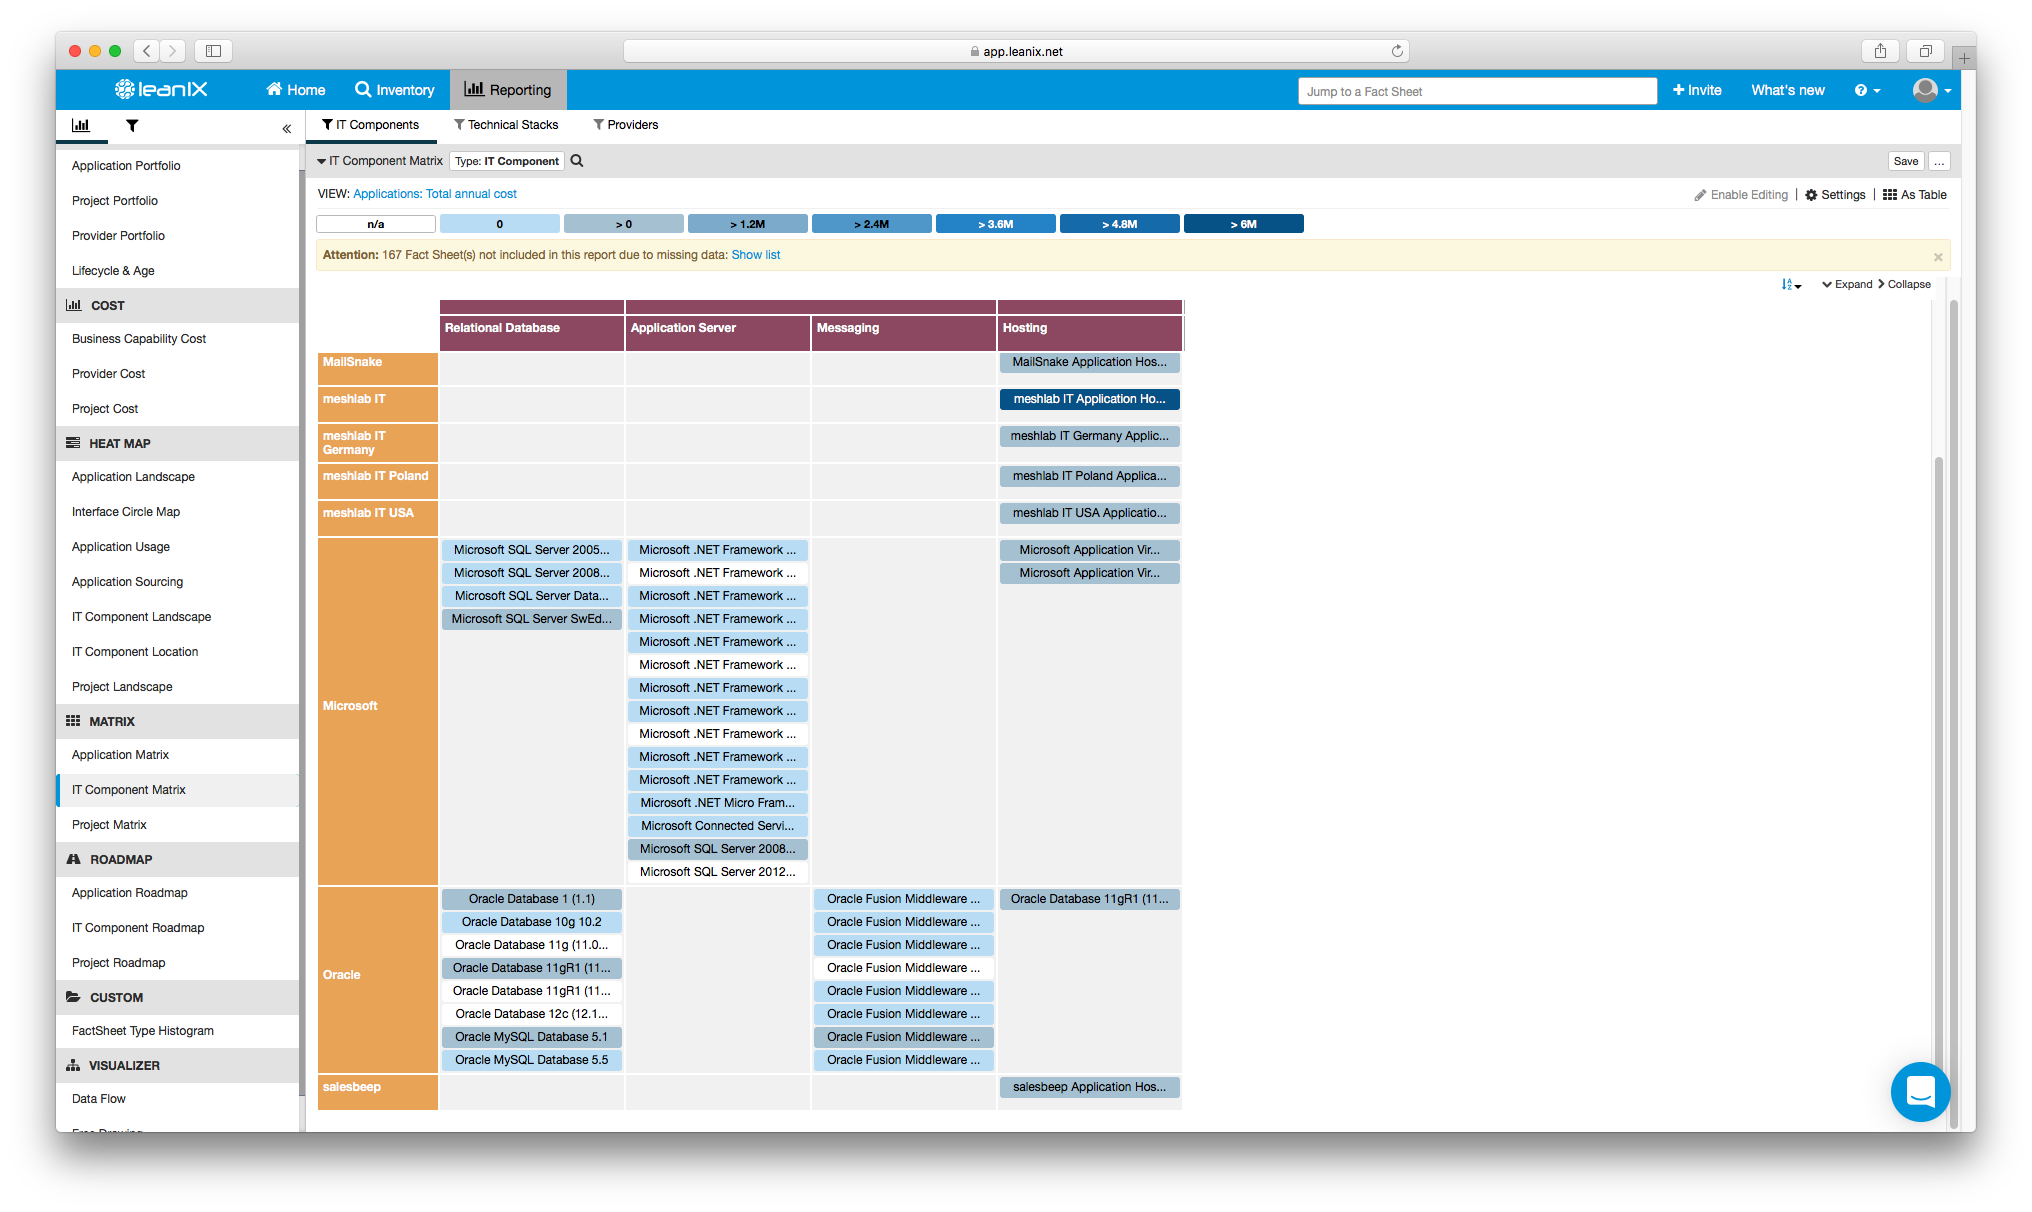
Image 8: The "Total Annual Costs" of IT Components, as seen in the LeanIX "IT Component Matrix" report.
Wasn’t it strange, you soon proffered to your colleagues, that we use both Oracle and MySQL? Why send money to both when only one is needed for our organization?
A decision, you declared while switching from the “Total annual cost” view to the “Lifecycle”, was necessary. You implored them to look at the below:
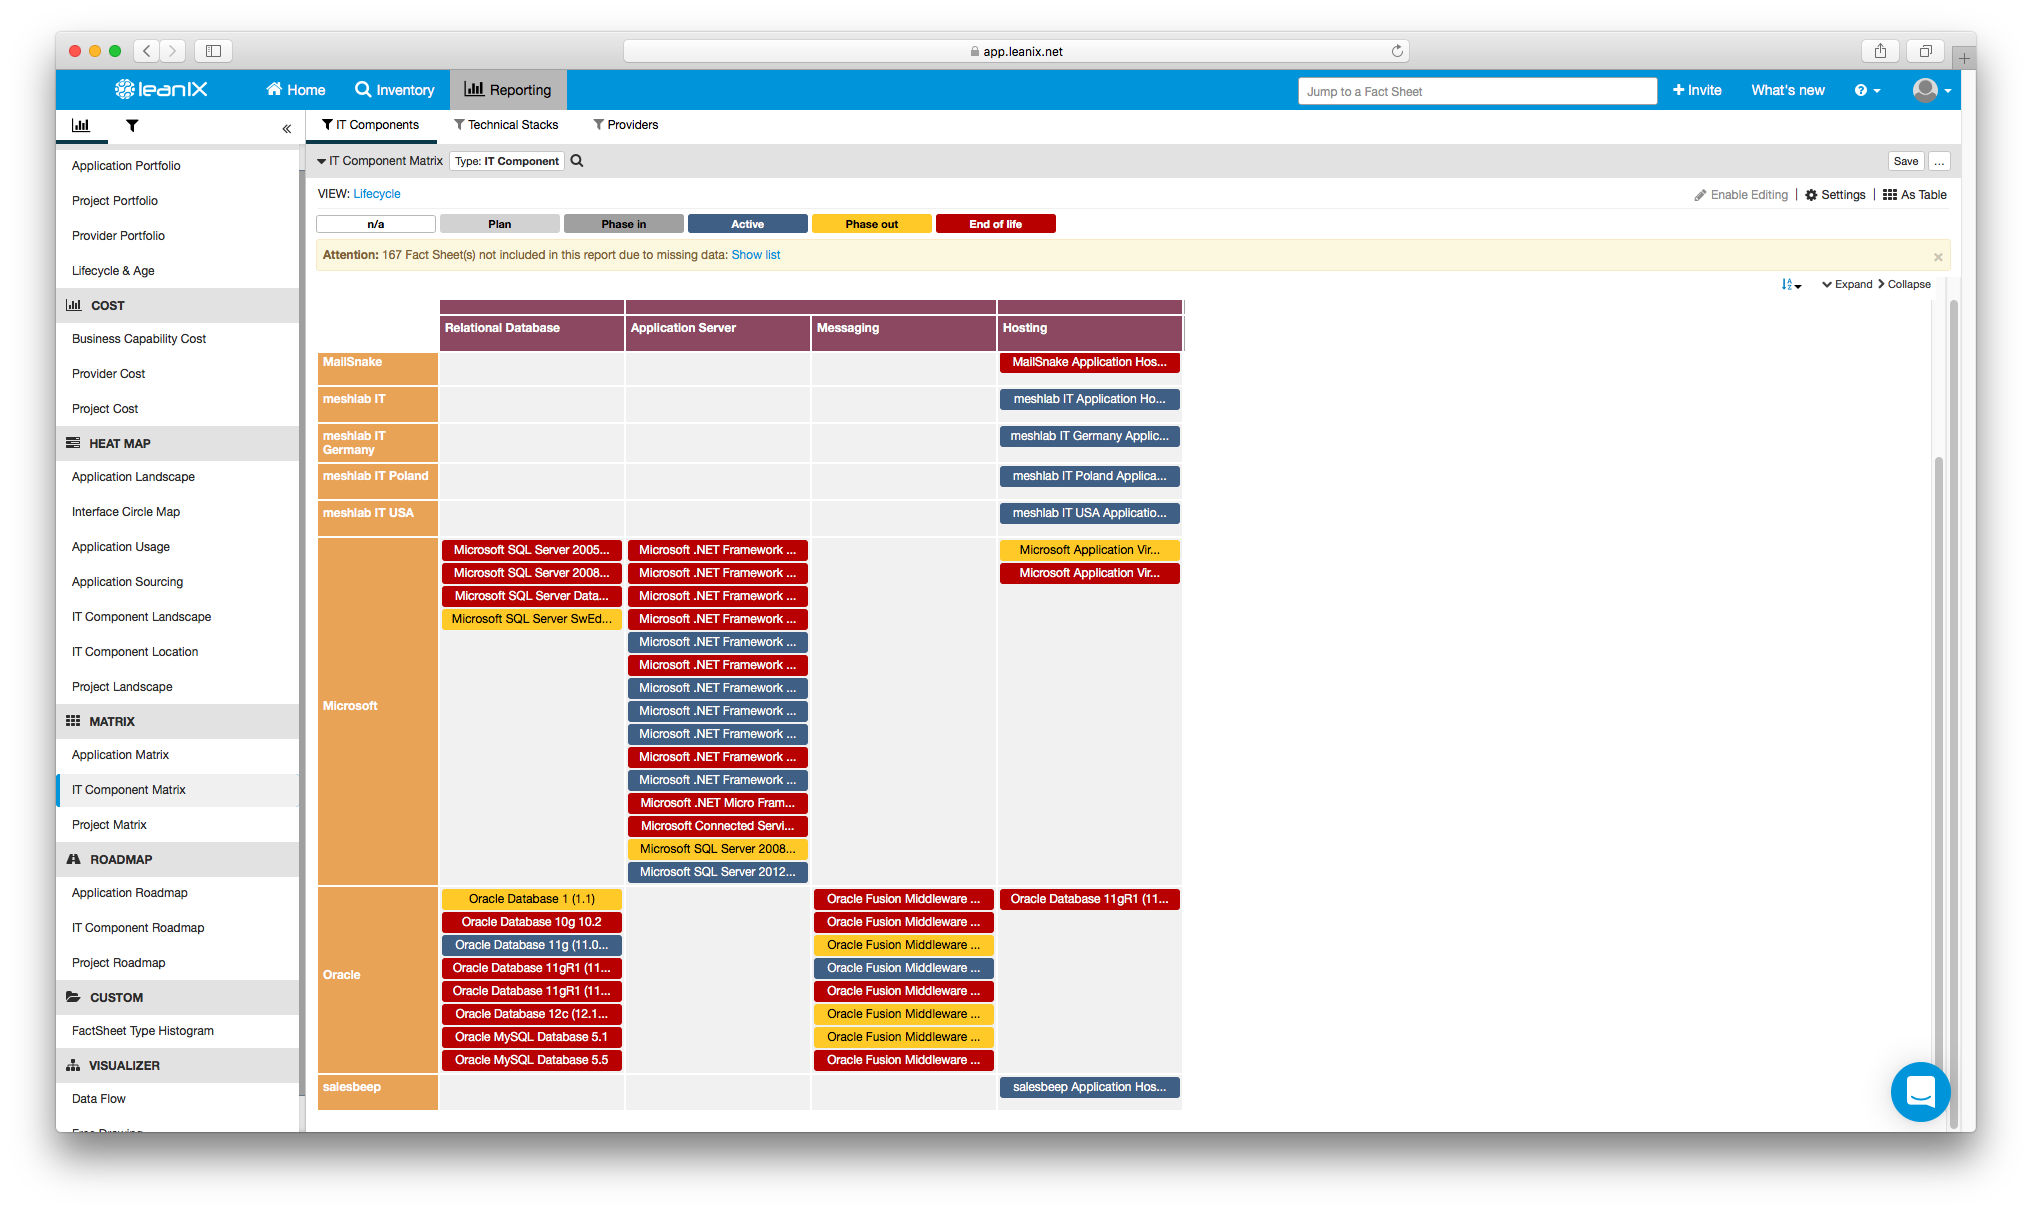
Image 9: The "Lifecycle" of IT Components, as seen in the LeanIX IT Component Matrix report.
Both options had hit the end of their service agreements—their “End of life”—without top management even realizing. Which one was to be revived? How much money was absently being wasted?
It would be your first win of many as an EA using LeanIX.
In Part 3, we unbox the Enterprise Architecture Success Kit to see more about how an EA Management tool can drive innovation.
Are you interested in sharing success stories from your first days as an Enterprise Architect? If so, please comment below!