
The eight people you must impress
At a glance:
- Software Developers
- Business Process Managers
- Finance Officers
- CIOs
- Data Security & Compliance Officers
- Solution Architects
- IT Program Management
- CTOs
Stakeholder Management ideally requires both zen and versatility. But for Enterprise Architects who keep forgetting to enroll in that 10-day Vipassana silent retreat their friend of a friend once took, there remain ways to coolly communicate the value of EA to mixed audiences.
No matter if speaking from an IT, Business, Operational, or Strategic perspective, a modern EA Management Tool can assuage all varieties of stakeholder concerns.
And we’ve conveniently arranged these ways into eight categories—each according to a specific breed of EA collaborator and concern.
Let’s explore them below.
Note: This blog post is a companion piece to two of our free downloadable resources:
1. Software Developers
Their role: To design, install, test, and maintain software systems.
Their common questions: How can an EA Management Tool help me connect with the anonymous gatekeepers of software information—specifically, those responsible for microservices—in my efforts to further dismantle monolithic applications?
Your offer: All inquiring minds can look at the names subscribed to a Fact Sheet. These are the users associated with an application because they are well-versed in its particularities, so, based on whatever relationship they have with the given architectural object (be it owner, responsible, or observer), your questions can be directed to the right individual.
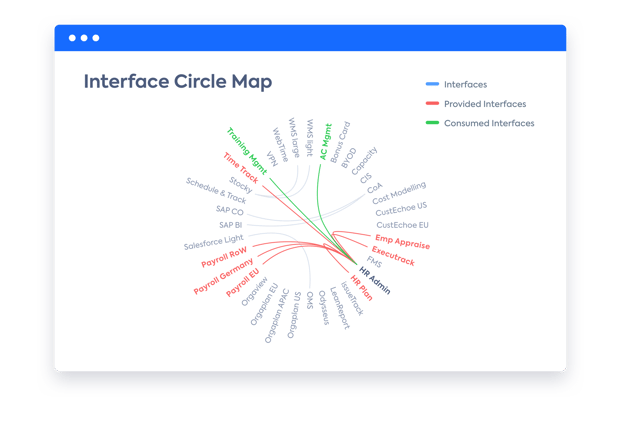
Image 1: Users subscribed to the LeanIX Fact Sheet "AC Management V1".
Follow this up by telling developers and operation teams to visualize the best ways to decouple their architecture into microservices using collaborative Free Drawing and Data Flow modeling tools.
For quick reference, software developers can access an EA Management Tool “Circle Map” for two-dimensional views of how the objects being modeled connect with business capabilities and IT components plus the precise ways in which their data is being funneled.
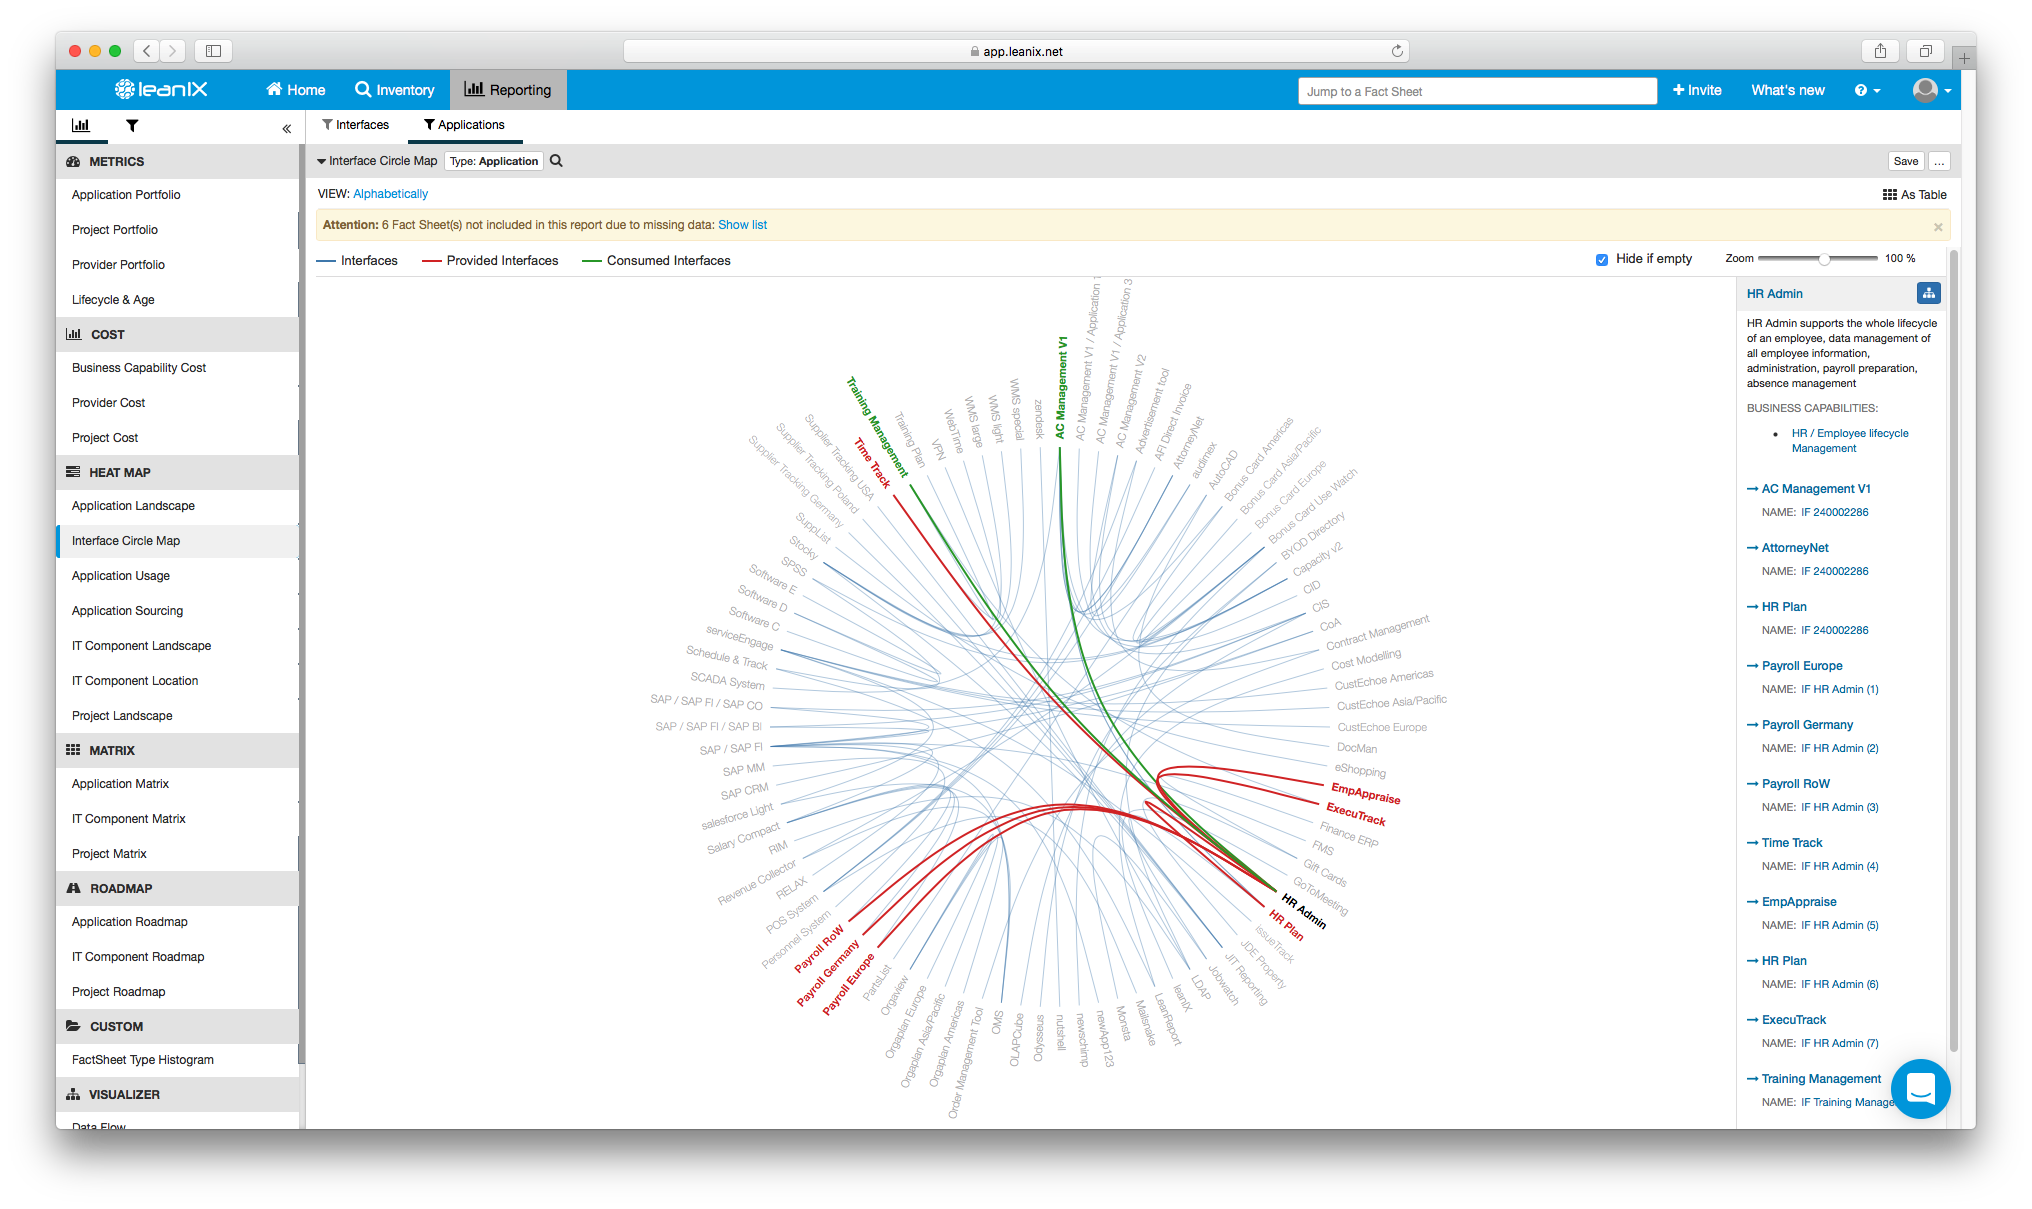
Image 3: A map of interrelated IT applications in a LeanIX Interface Circle Map.
2. Business Process Manager
Their role: To document and improve business processes.
Their common questions: Which applications support a process? Are these the right applications (i.e., the most “functional fit”) for the job? Also, in case of a complete breakdown in this technology, how might the process be disrupted?
Your offer: Inside an EA Management Tool “Application Matrix” report, one configured to a view of “Functional Fit” and set with “Processes” appearing at the top axis, any interested Business Process Manager can study a color-coded map of functionally Unreasonable > Insufficient > Appropriate > Perfect applications from organizational units across all regions. Explore from any enterprise hierarchy level, too.
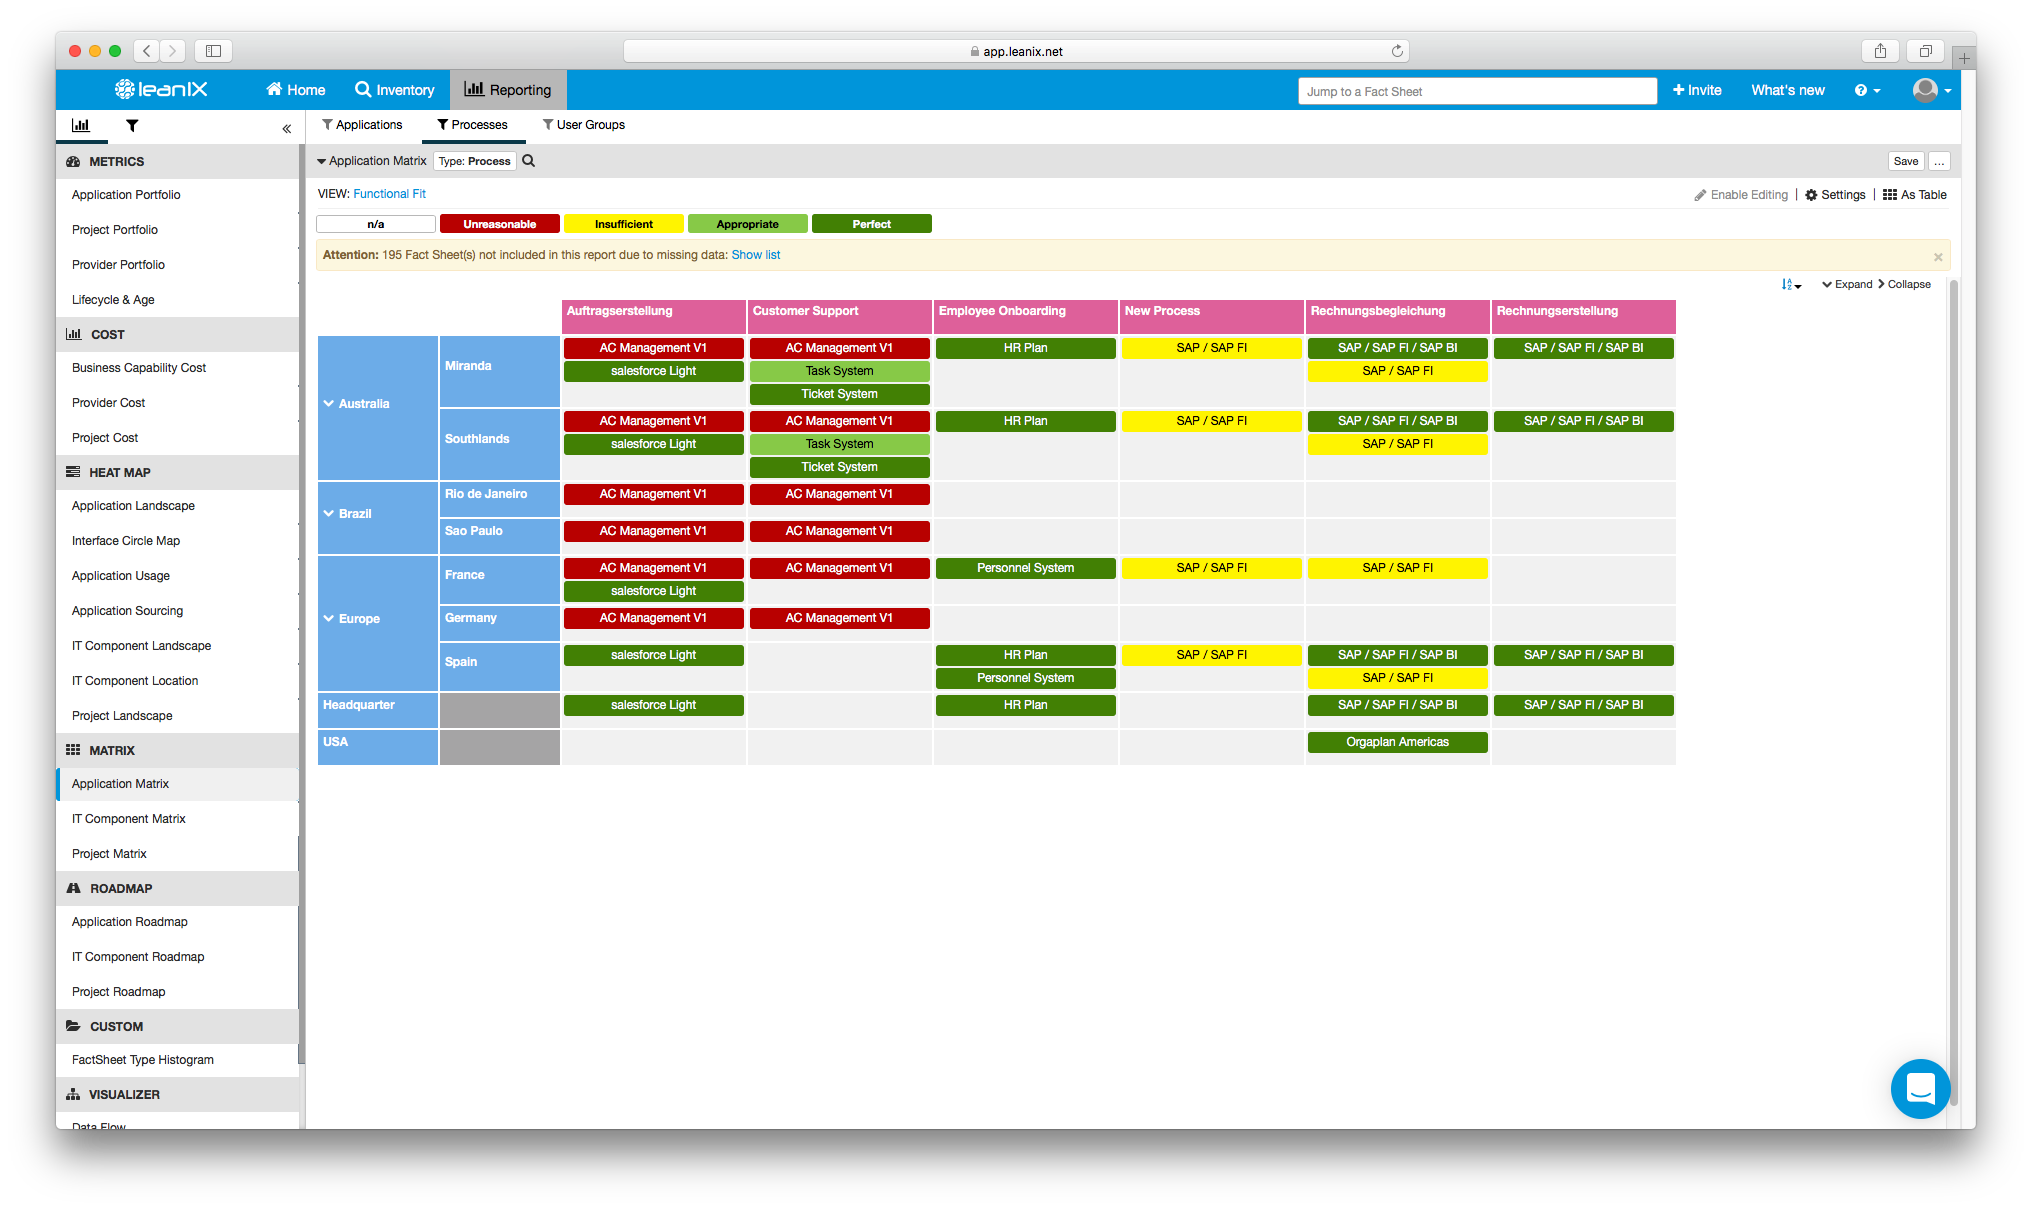
Image 4: A look at processes by their "Functional Fit" inside a LeanIX Application Matrix report.
Refer the stakeholder also to the “Application Landscape” tool—an alternate way to examine the Functional Fit of processes from standpoints such as “GDPR compliance”, “Business Criticality”, and “Lifecycles”.
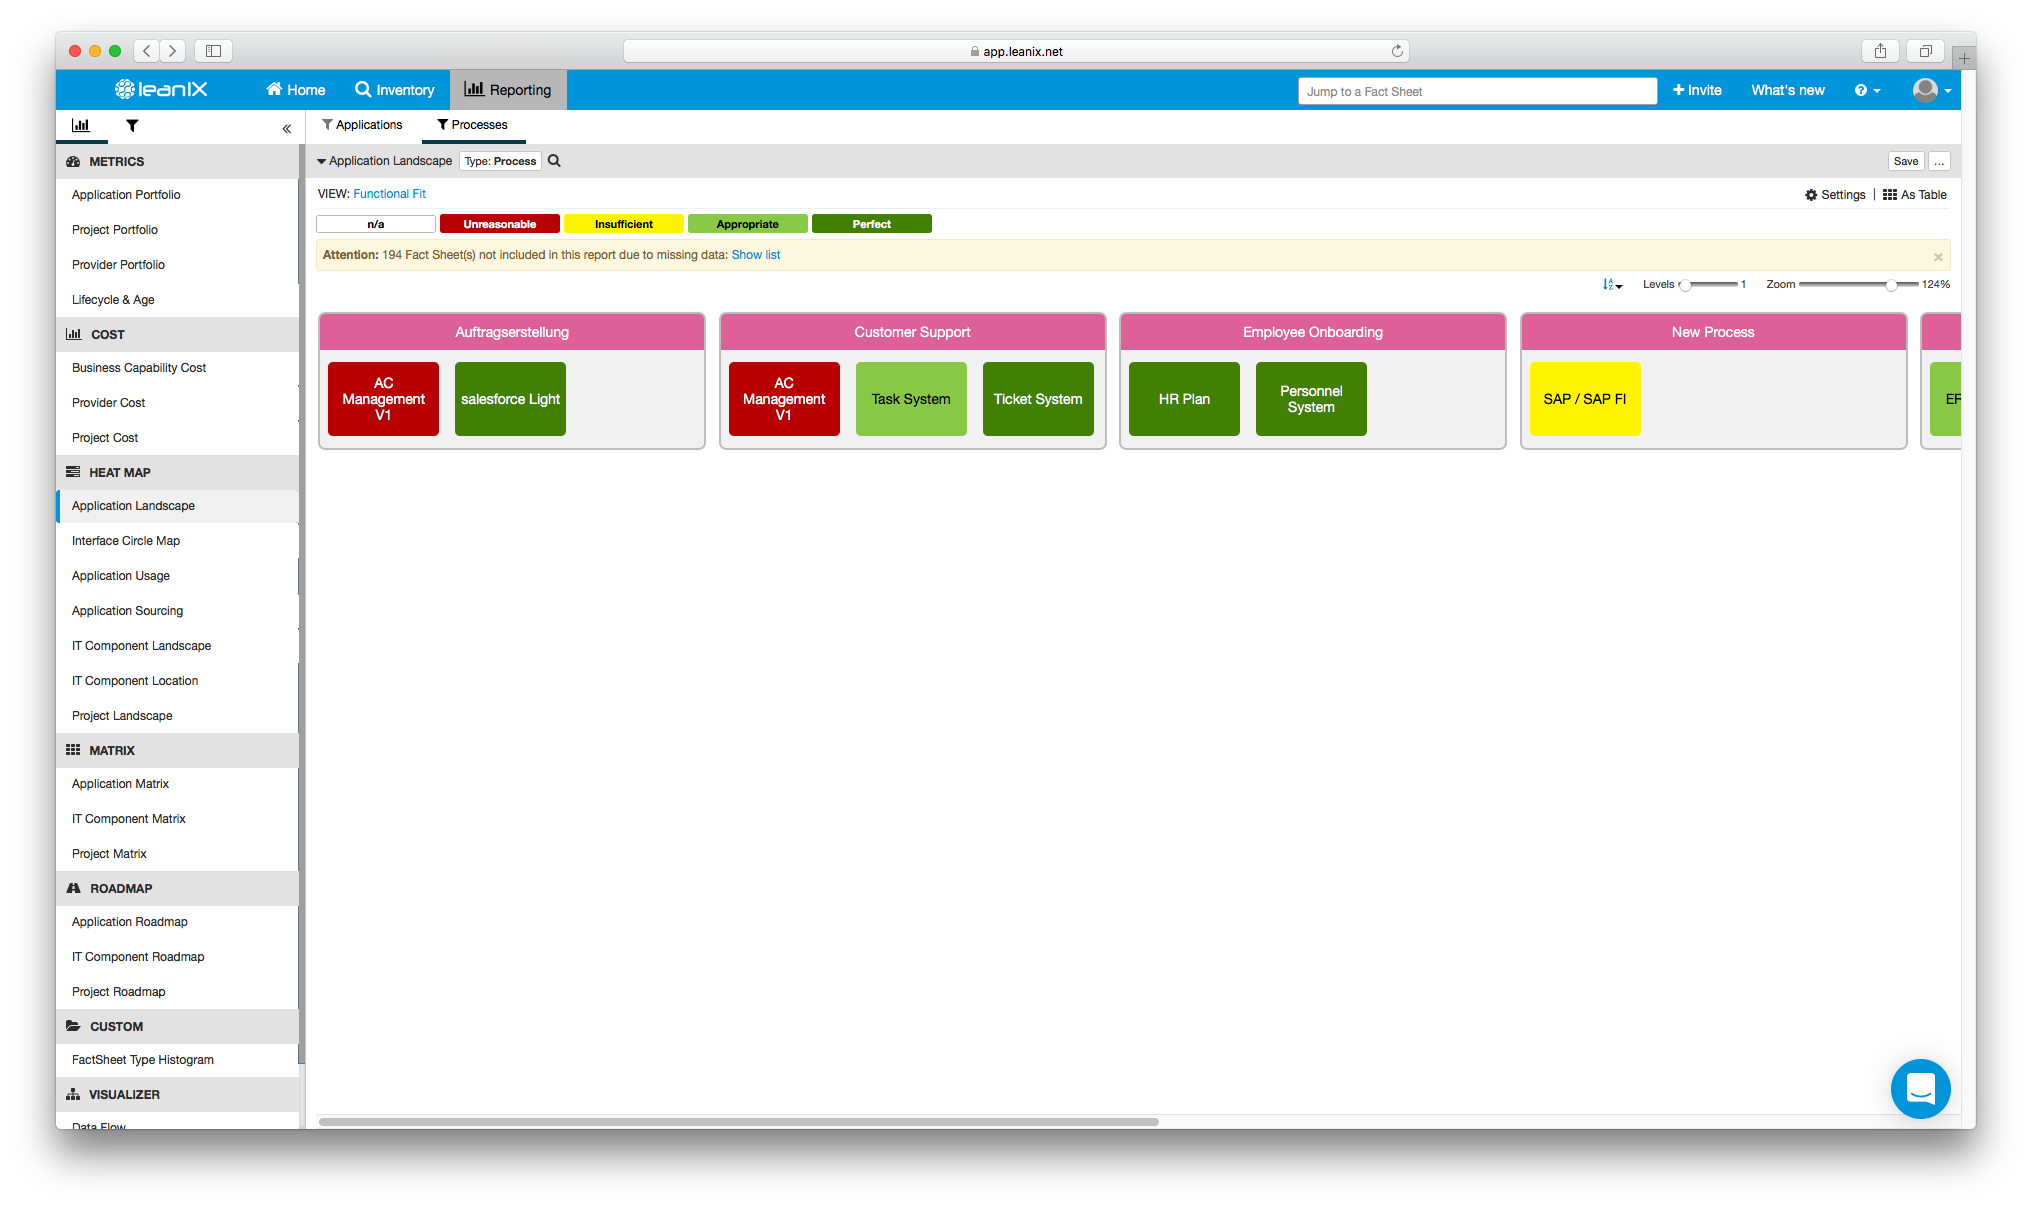
Image 5: The "Functional Fit" of processes as seen in a LeanIX Application Landscape report.
Keep in mind that most reporting mechanisms offered by a modern EA Management Tool can be observed by processes alone.
3. Finance Officer
Their role: To oversee the financial health of a company.
Their common questions: How much is truly being spent on IT—and to whom are we giving our money? Show us a breakdown in terms of IT spend by the provider and according to business capability. Make clear also the IT budget plans for all current/future projects.
Your offer: Point these discerning individuals in the direction of the Cost Reporting category of the EA Management Tool. Incredibly enough, there are pre-programmed reports designed specifically according to Business Capability, Provider, and Project!
For instance, in the Business Capability Cost Report, you can filter the costs of applications down to any Technical Fit-level to see all ranges of costs associated with a capability.
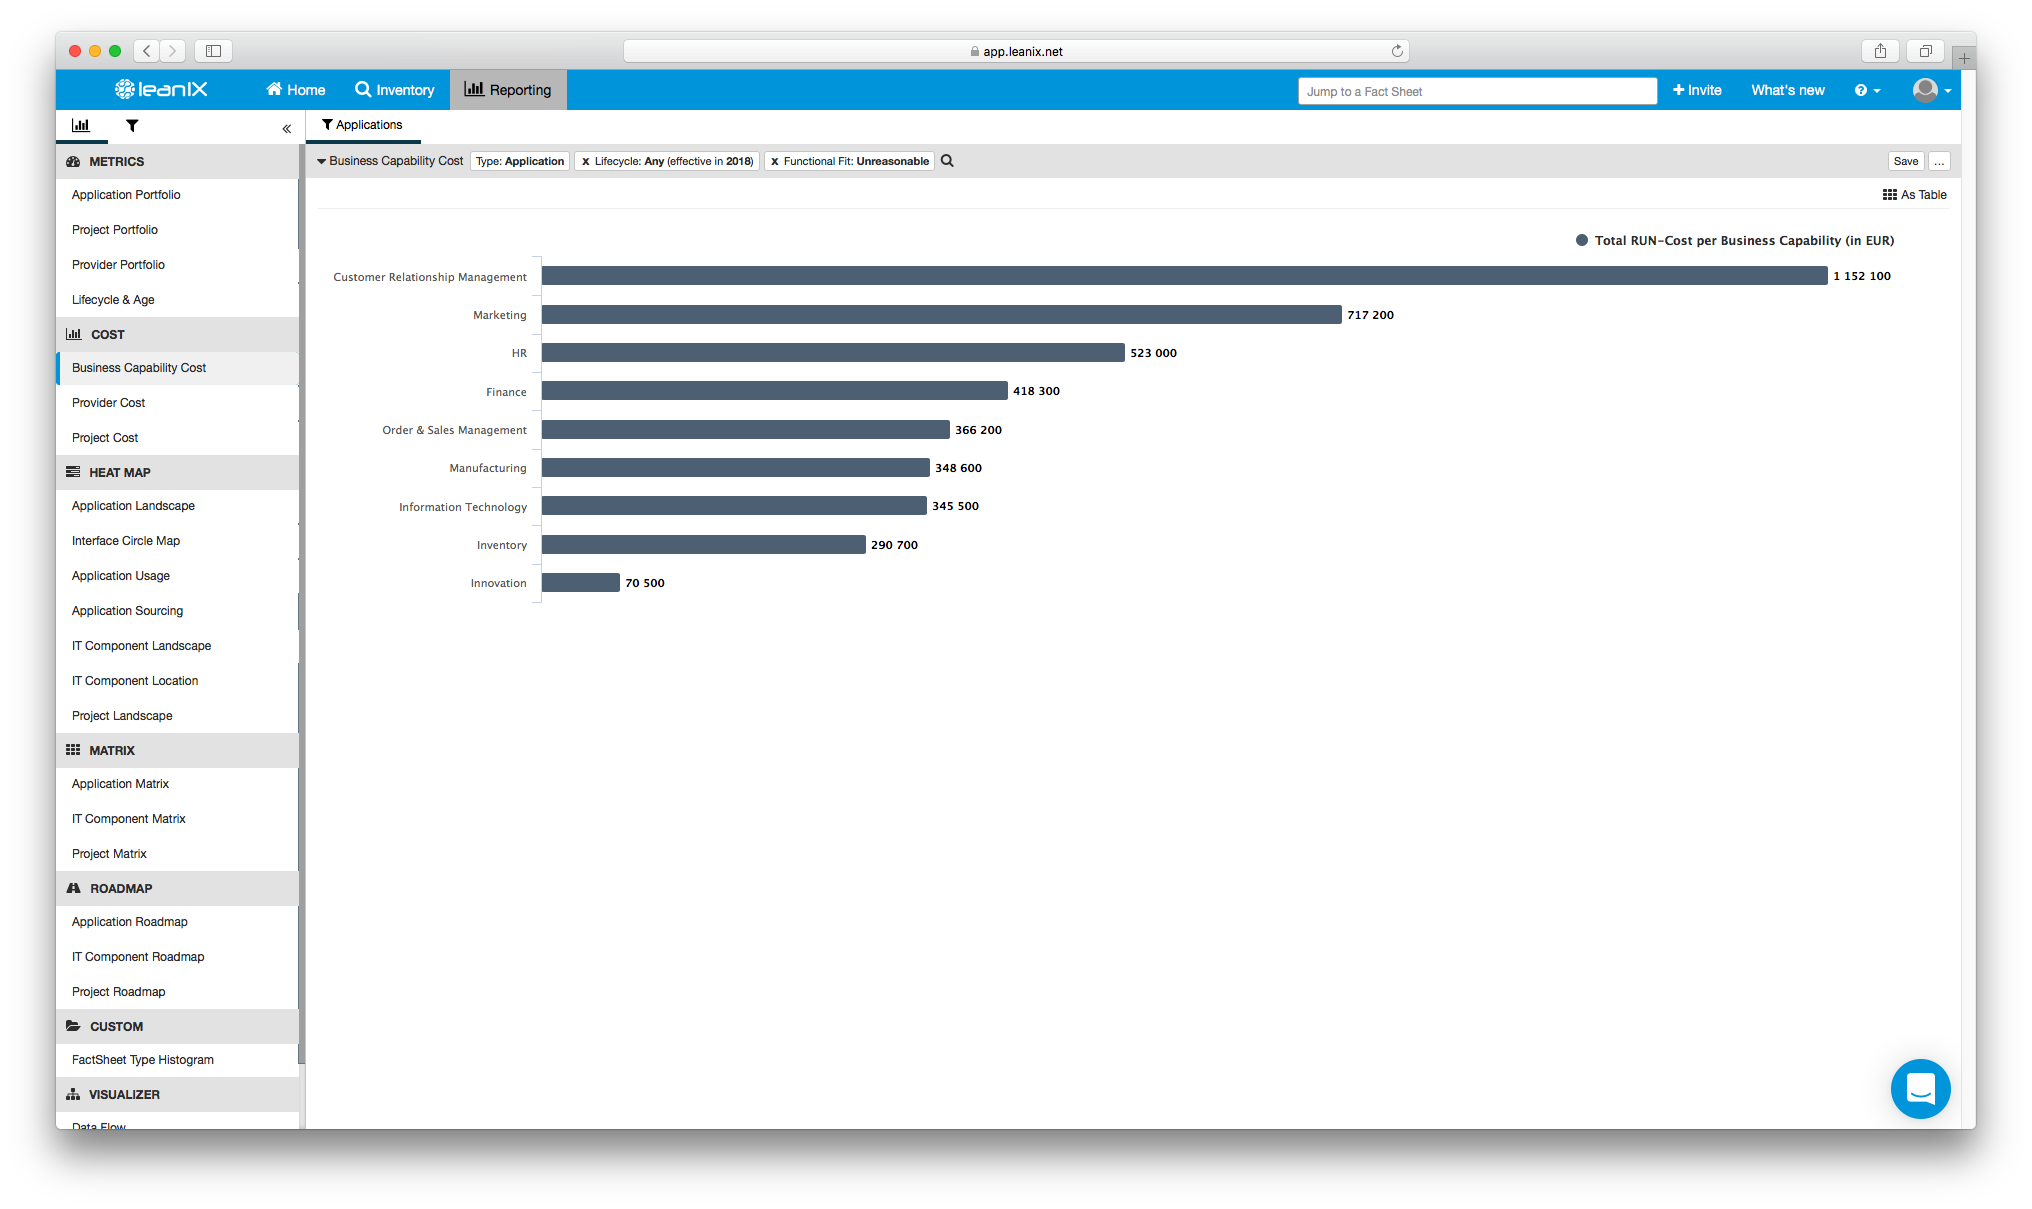
Image 6: A Business Capability Cost Report, set by an "Unreasonable Technical Fit", in LeanIX.
Consider also a Provider Cost Report, similar to the Business Capability Cost Report, which gives a clear, visual breakdown (read: pie chart) of who is receiving the lion’s share of your IT operation costs. Filter options include “Provider Quality” and “Provider Criticality”. Also, depending on how sophisticated your tagging efforts, it is possible to see the myriad ways each provider benefits a region, service, or strategy.
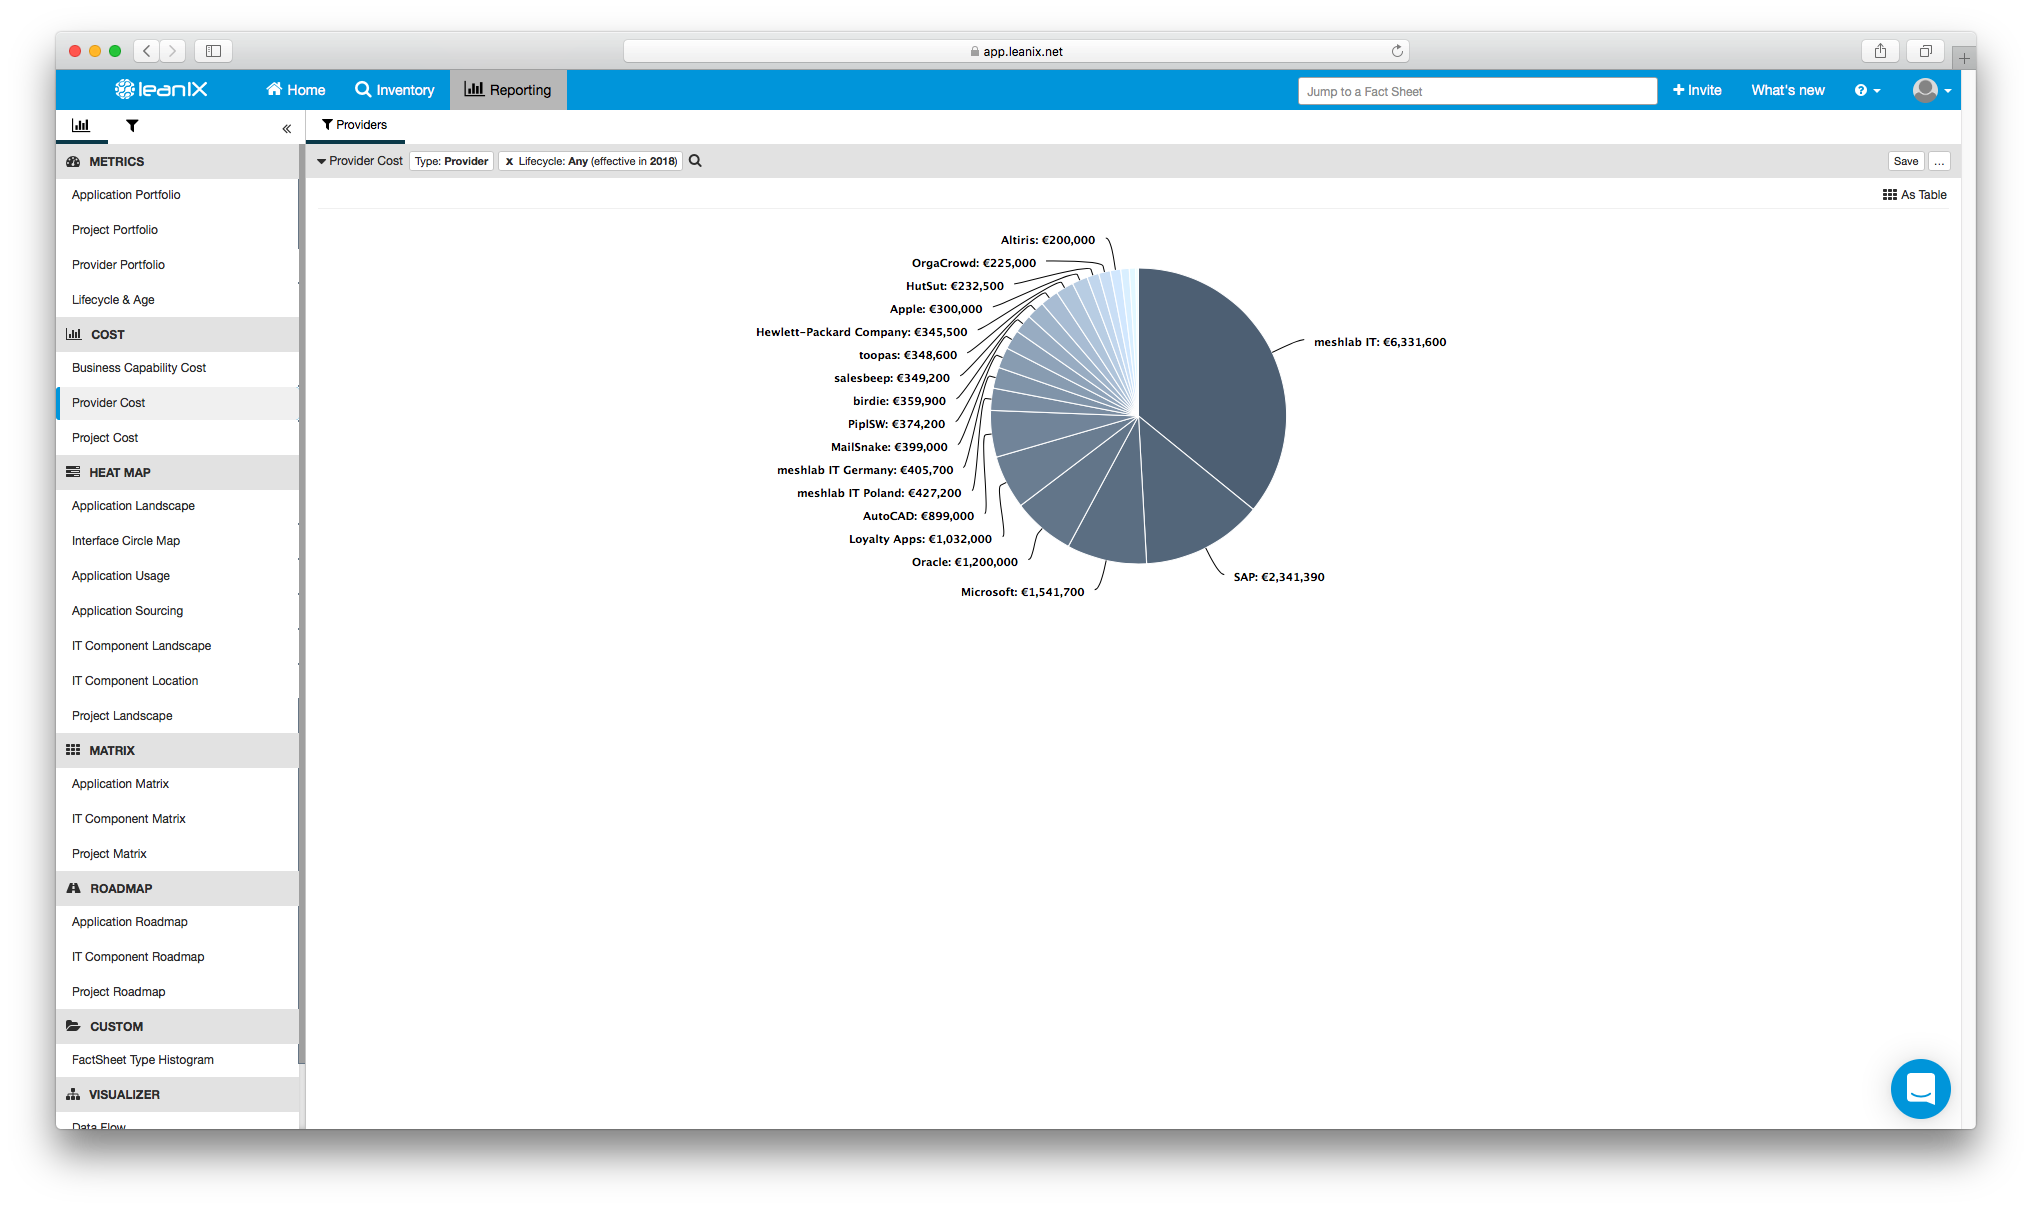
Image 7: A LeanIX Provider Cost report showing the cost of software providers used by an organization.
In tabular format, a Project Cost report lists in perfect detail the IT budget across all projects. Columns can be adjusted as needed, and information uniquely filtered by category and dependent applications—all of which to produce a configurable, single-page overview of budget and orders.
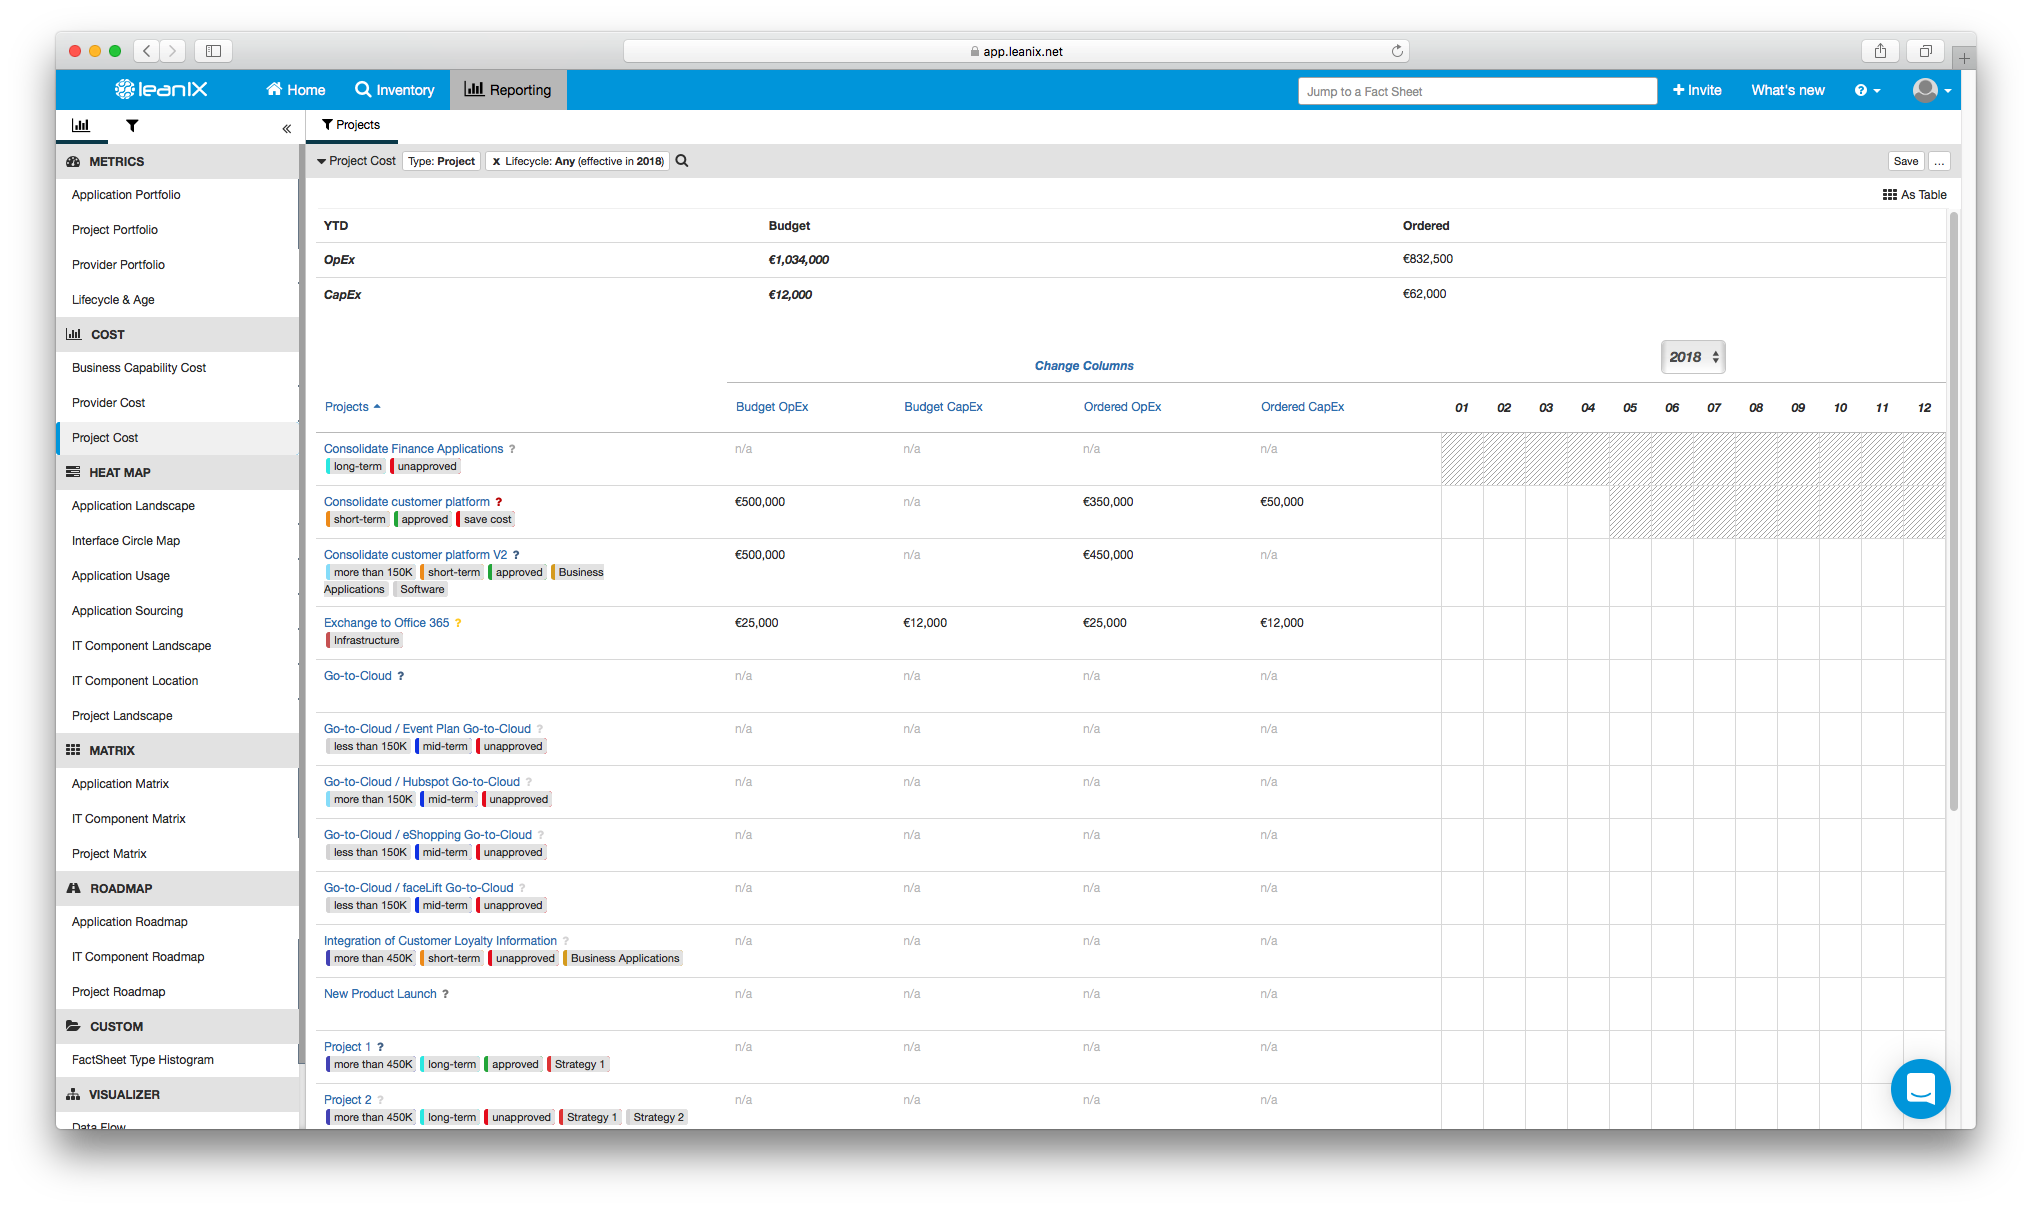
Image 8: A LeanIX Project Cost report showing the budget of an organization's IT spend.
![Enterprise Architecture Success Kit [White Paper]: Everything you need for quick time-to-value and long-term success through EA. »](https://no-cache.hubspot.com/cta/default/2570476/17fd5630-69af-4c4c-82f1-8e88da49fc47.png)
4. CIO
Their role: To create business value from technology.
Their common questions: Precisely how does the enterprise’s application lifecycle landscape look—is it rationalized best for achieving short-, medium-, or long-term measures? If judging this same application landscape, is it clear where we should further invest/divest (i.e., based on technical and functional criteria)? What is the overall cost structure?
Your offer: Flash a muted smile, take your CIO by the hand (or not), and go on a dance through the wonderland of a fully configurable “Application Roadmap”—a place where the strength of every application and its corresponding “children” and “successors” can be observed, by year and along with clear horizontal timelines, as according to measurements like “Data Quality”, “Lifecycle”, “GDPR Classification”, “Data Objects” (employee, supplier, user, etc.), and “Business Criticality”.
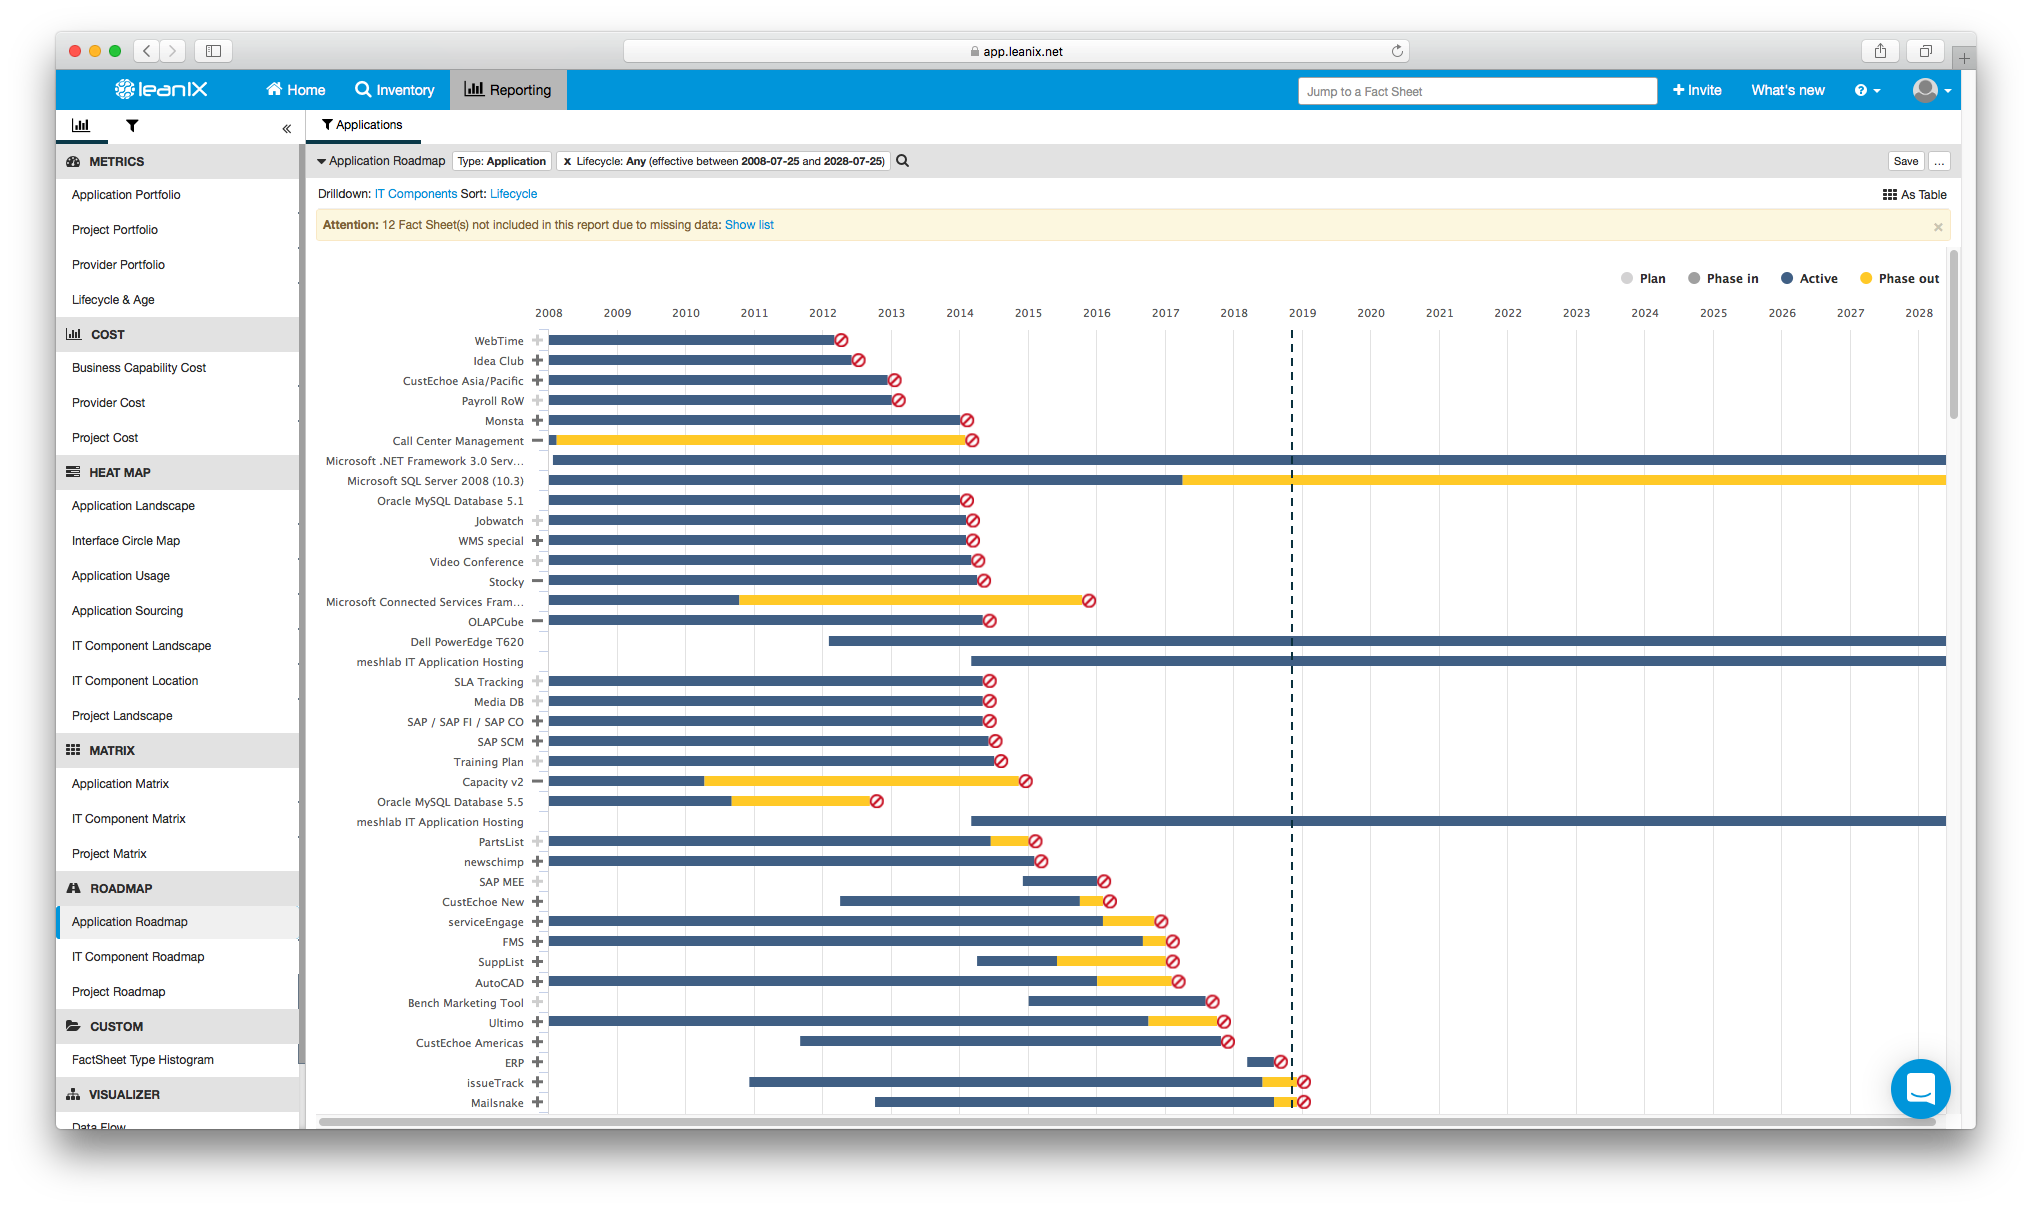
Image 9: An Application Roadmap report in LeanIX showing the lifecycle of applications and their associated applications.
If your CIO is not out of breath from singing your praises, proceed to an introduction of the “Application Portfolio” metric. Show them how investment decisions about projects can be derived from this interactive, graph-based report and its three core views: “Functional Fit vs. Technical Fit”; “Functional Fit vs. Business Criticality”; and “Technical Fit vs. Business Criticality”. The results are grouped into colored circles, the size and position of each reflecting the underlying value.
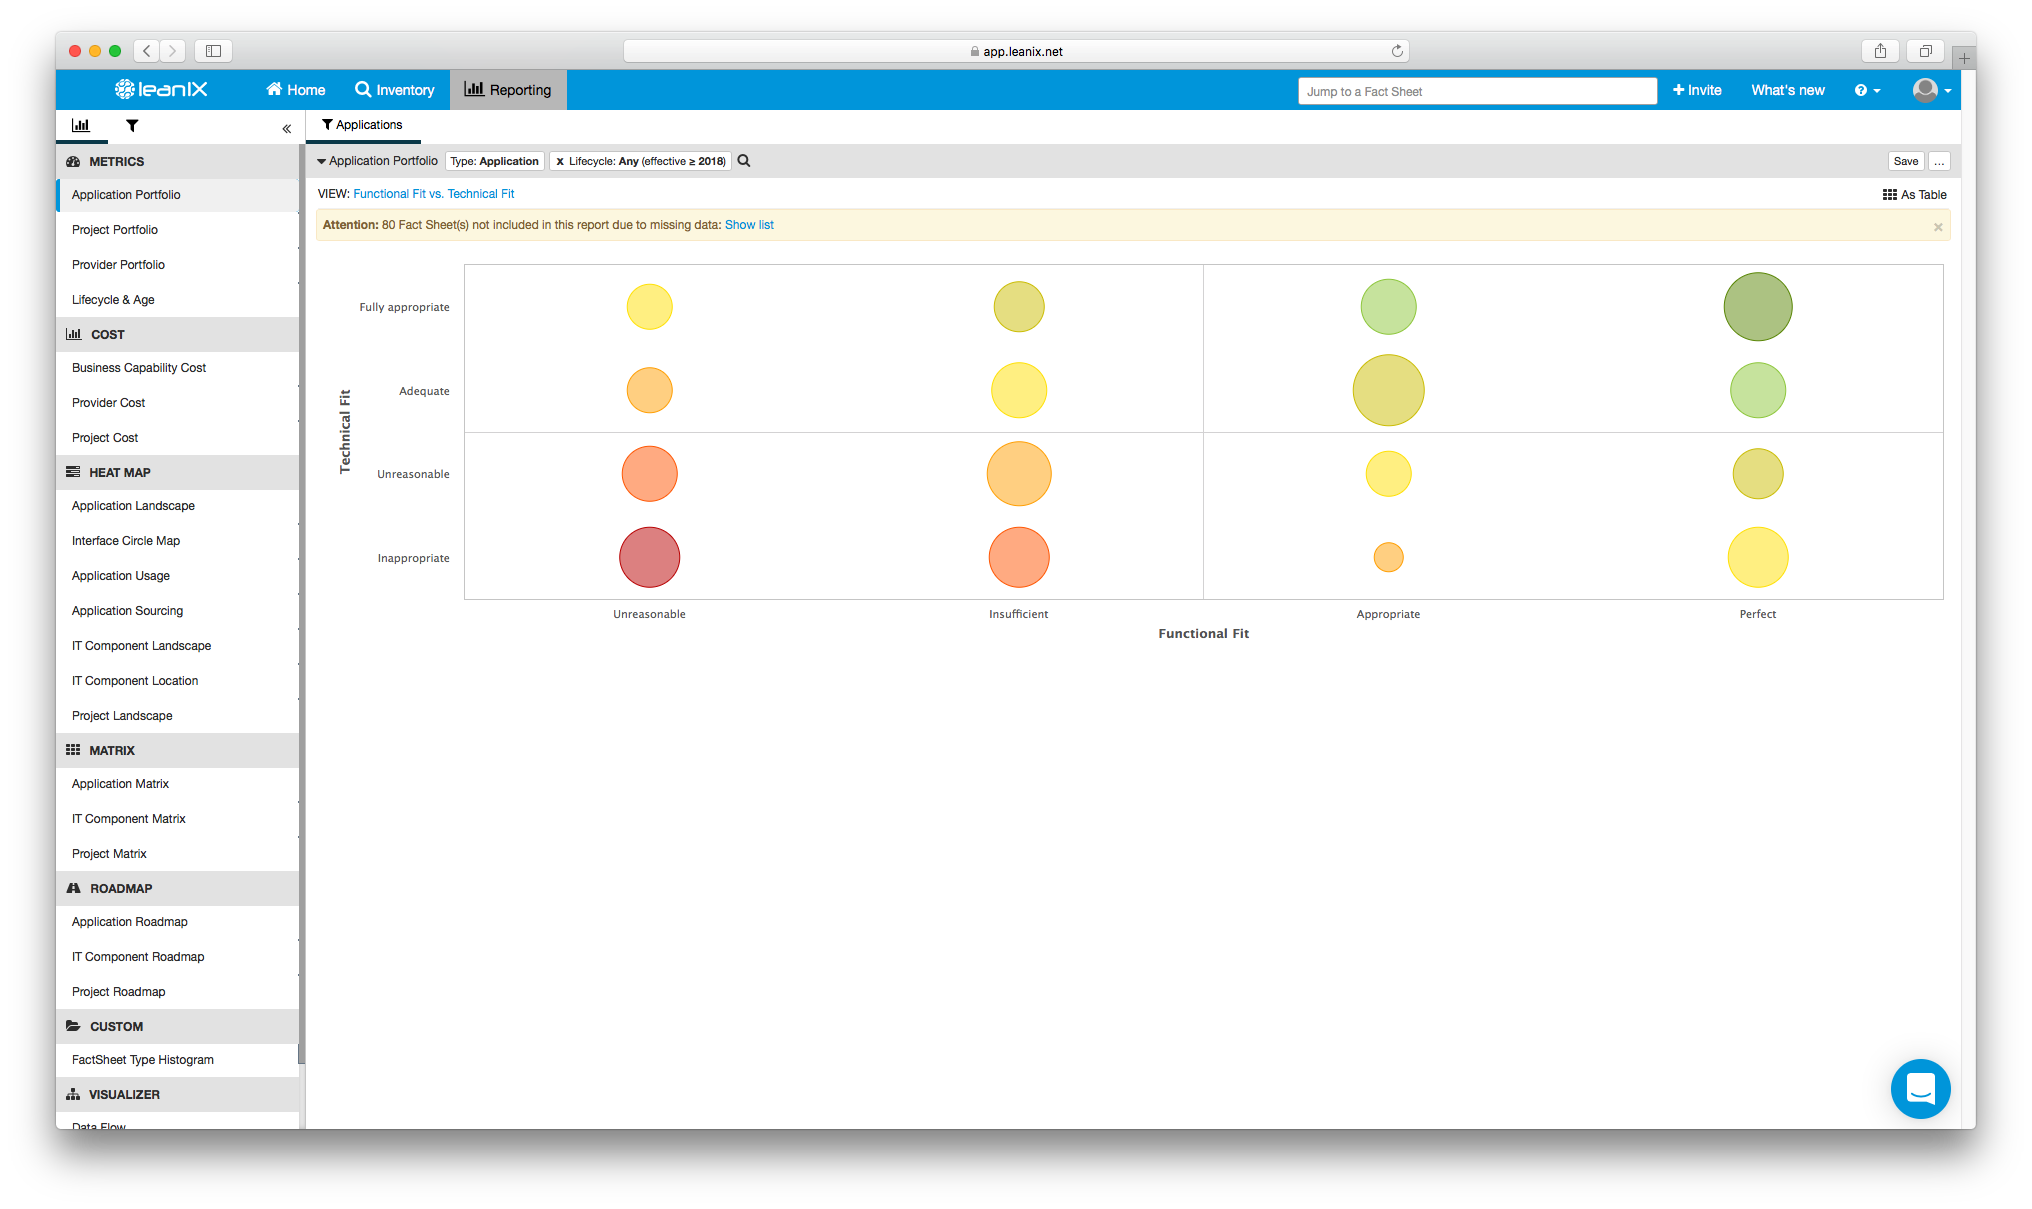
Image 10: A LeanIX Application Portfolio metric showing the Functional Fit vs. Technical Fit of applications.
And as for CIO questions regarding overall cost structure, simply reveal the aforementioned Provider Cost Report. But, for the sake of originality, demonstrate how the report is also available in tabular format…
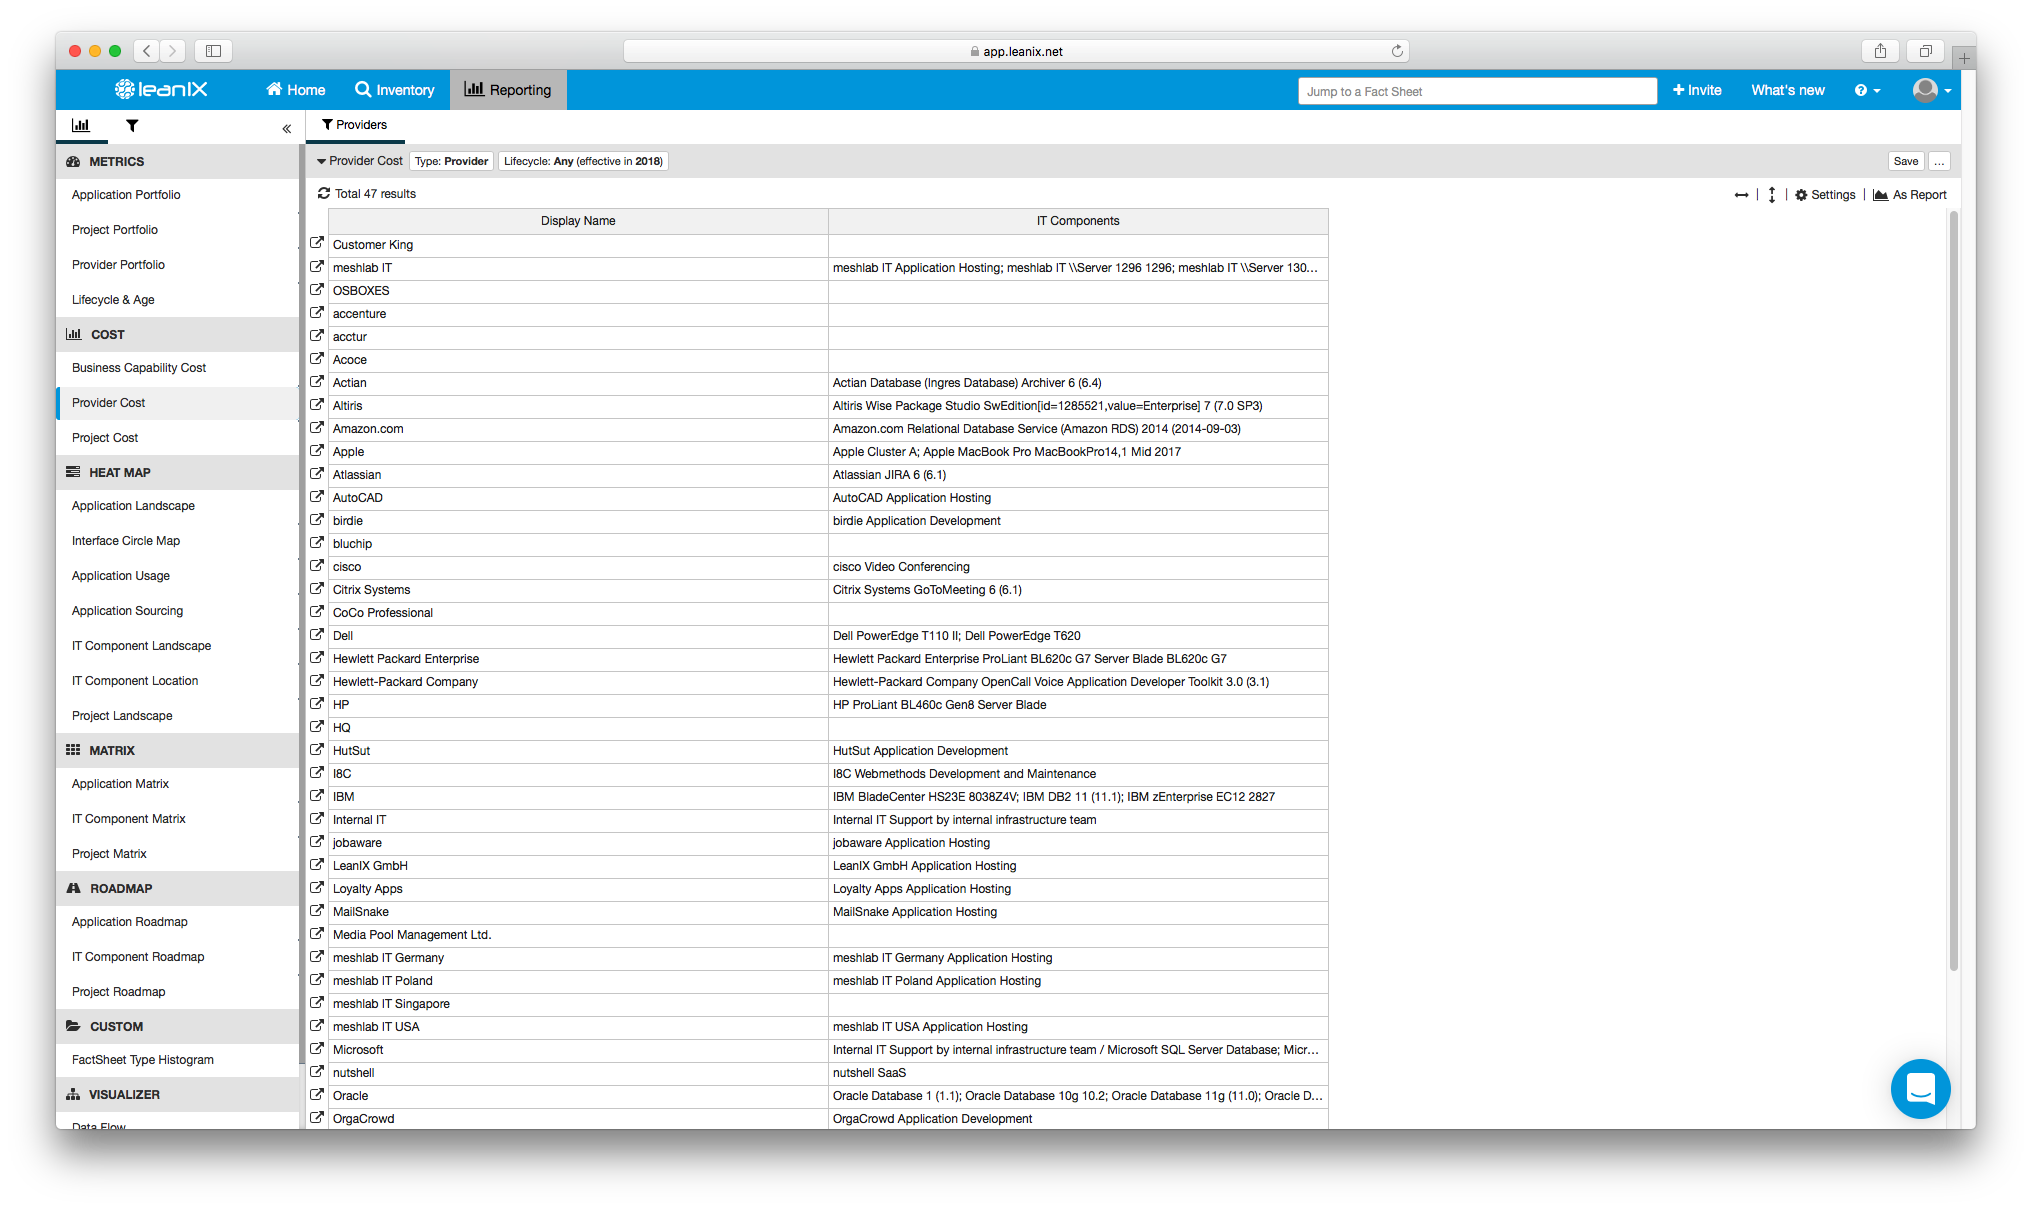 Image 11: A LeanIX Provider Cost report shown as a table.
5. Data Security & Compliance
Their role: To ensure compliance of applications and data processing.
Their common questions: Is the enterprise complying with security standards? Is our IT landscape built to properly handle and store sensitive data—and which applications are holding this information?
Your offer: A Risk Assessment Survey, one designed entirely from scratch or built from a template, is a tried and tested way for Data Security & Compliance officers to unlock the collaborative benefits of a modern EA Management Tool. Such an assessment allows officers to extensively poll and pool responses from responsible parties on security compliance in order to field comprehensive data compliance tests. Surveys are an essential component of LeanIX’s EA Management Tool and a way to evaluate security preparedness (in particular, GDPR readiness…).
In the example below for a “2018 IT Security Survey”, various options on how to narrow down the parameters of questions can be seen…
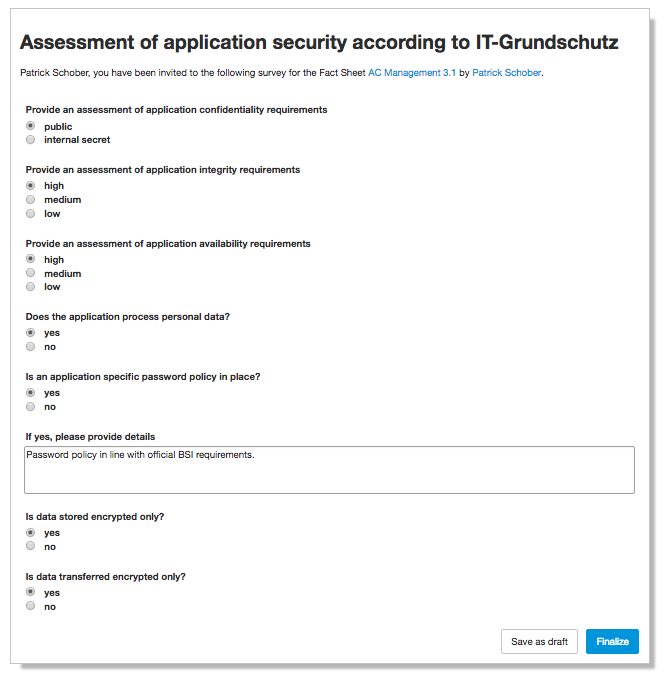
Image 12: An IT Security Survey made and sent from LeanIX.
To observe where data is exchanged within the IT landscape, and to locate areas where it is not flowing according to security guidelines, present the aforementioned Data Flow tool—the configurable flow-chart automatically generated from the contents of an application’s LeanIX Fact Sheet and its various dependencies.
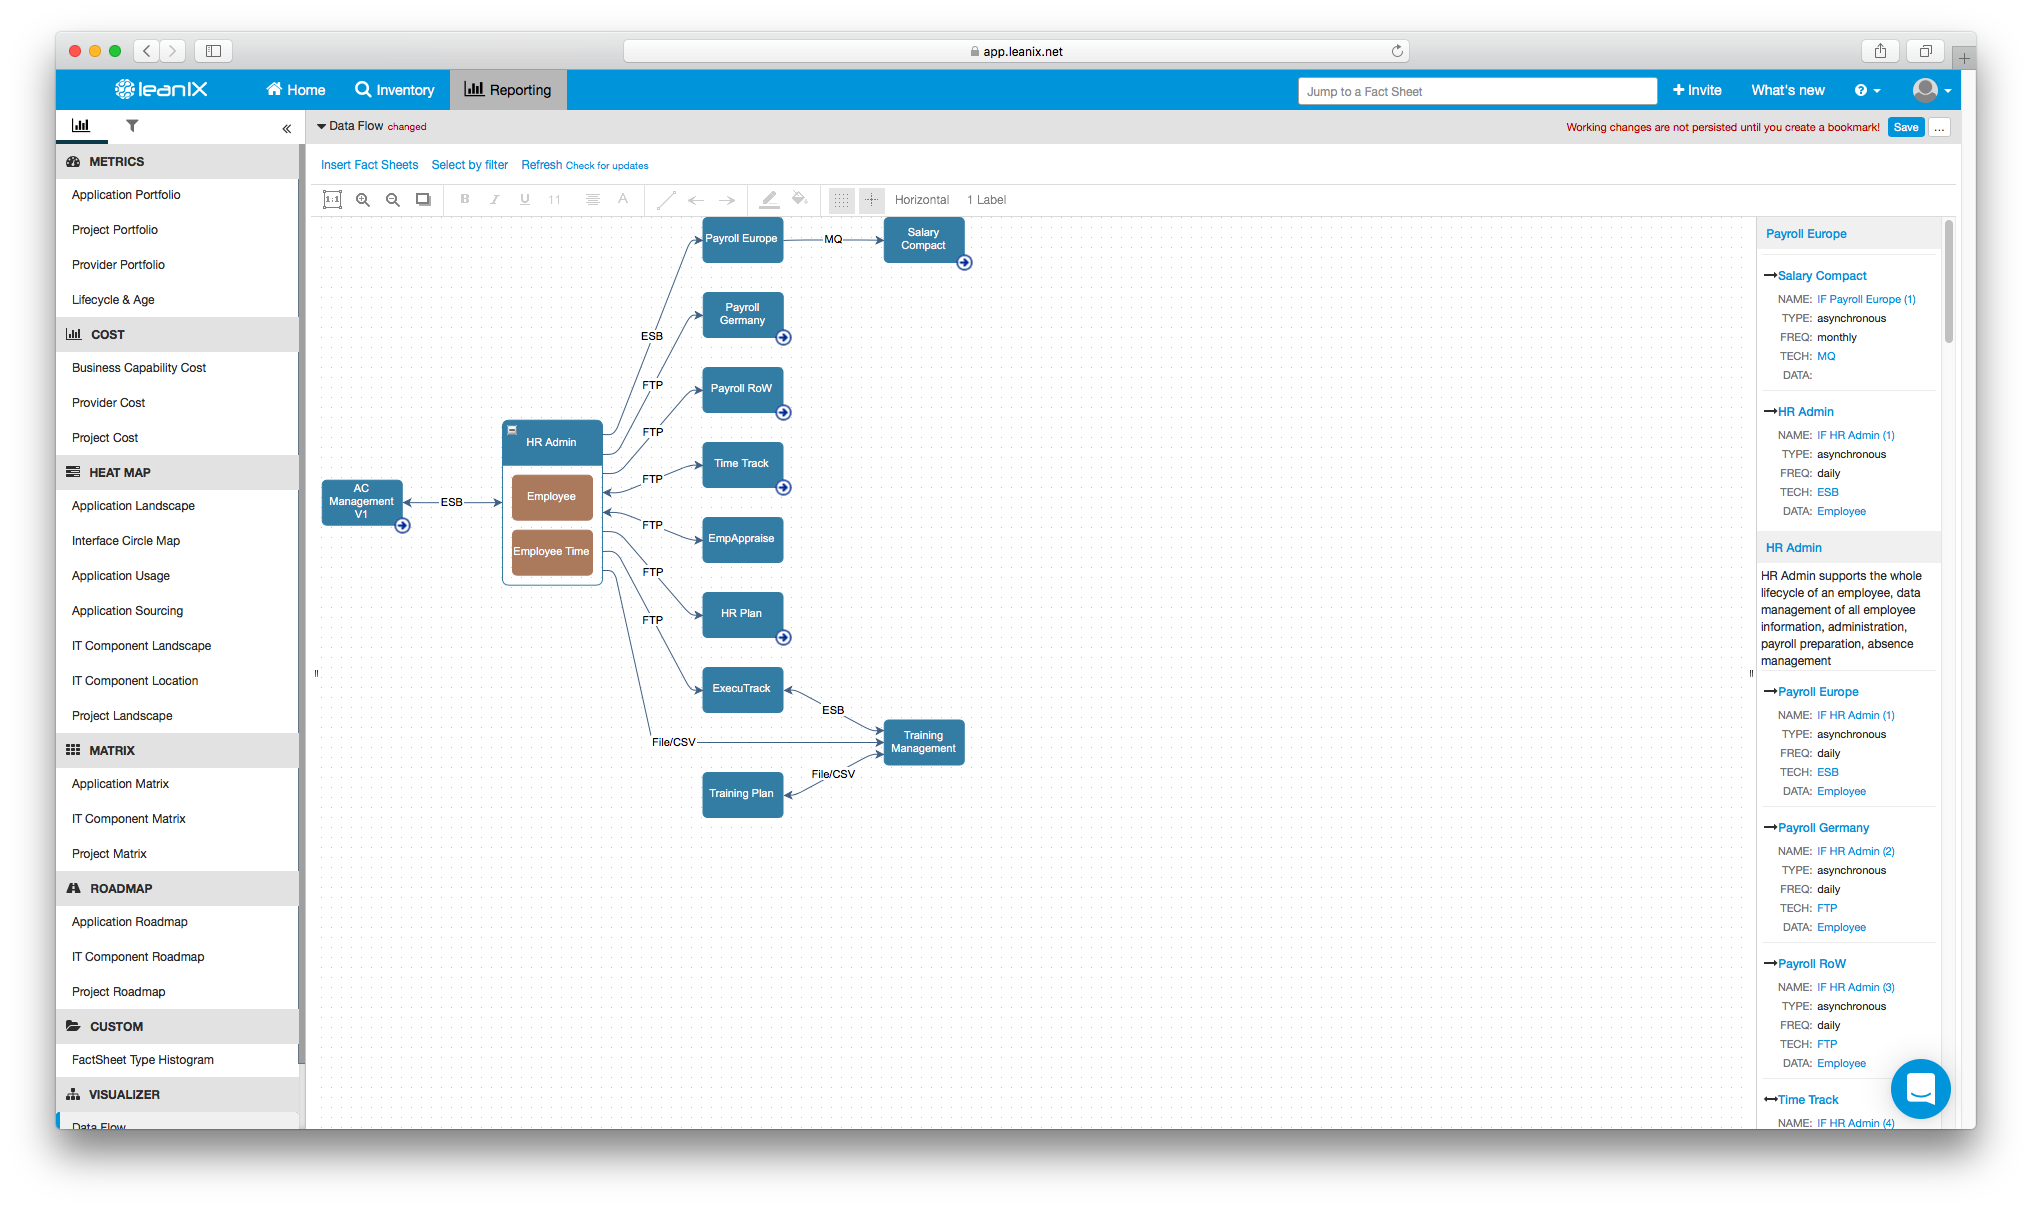
Image 13: A Data Flow model, as composed in LeanIX, showing the relationships of information between HR processes.
And to further supplement a data security and compliance analysis, the Application Landscape report can be filtered down to the key Business Capabilities responsible for managing private customer data and then viewed according to security elements like the strength of its GDPR compliance.
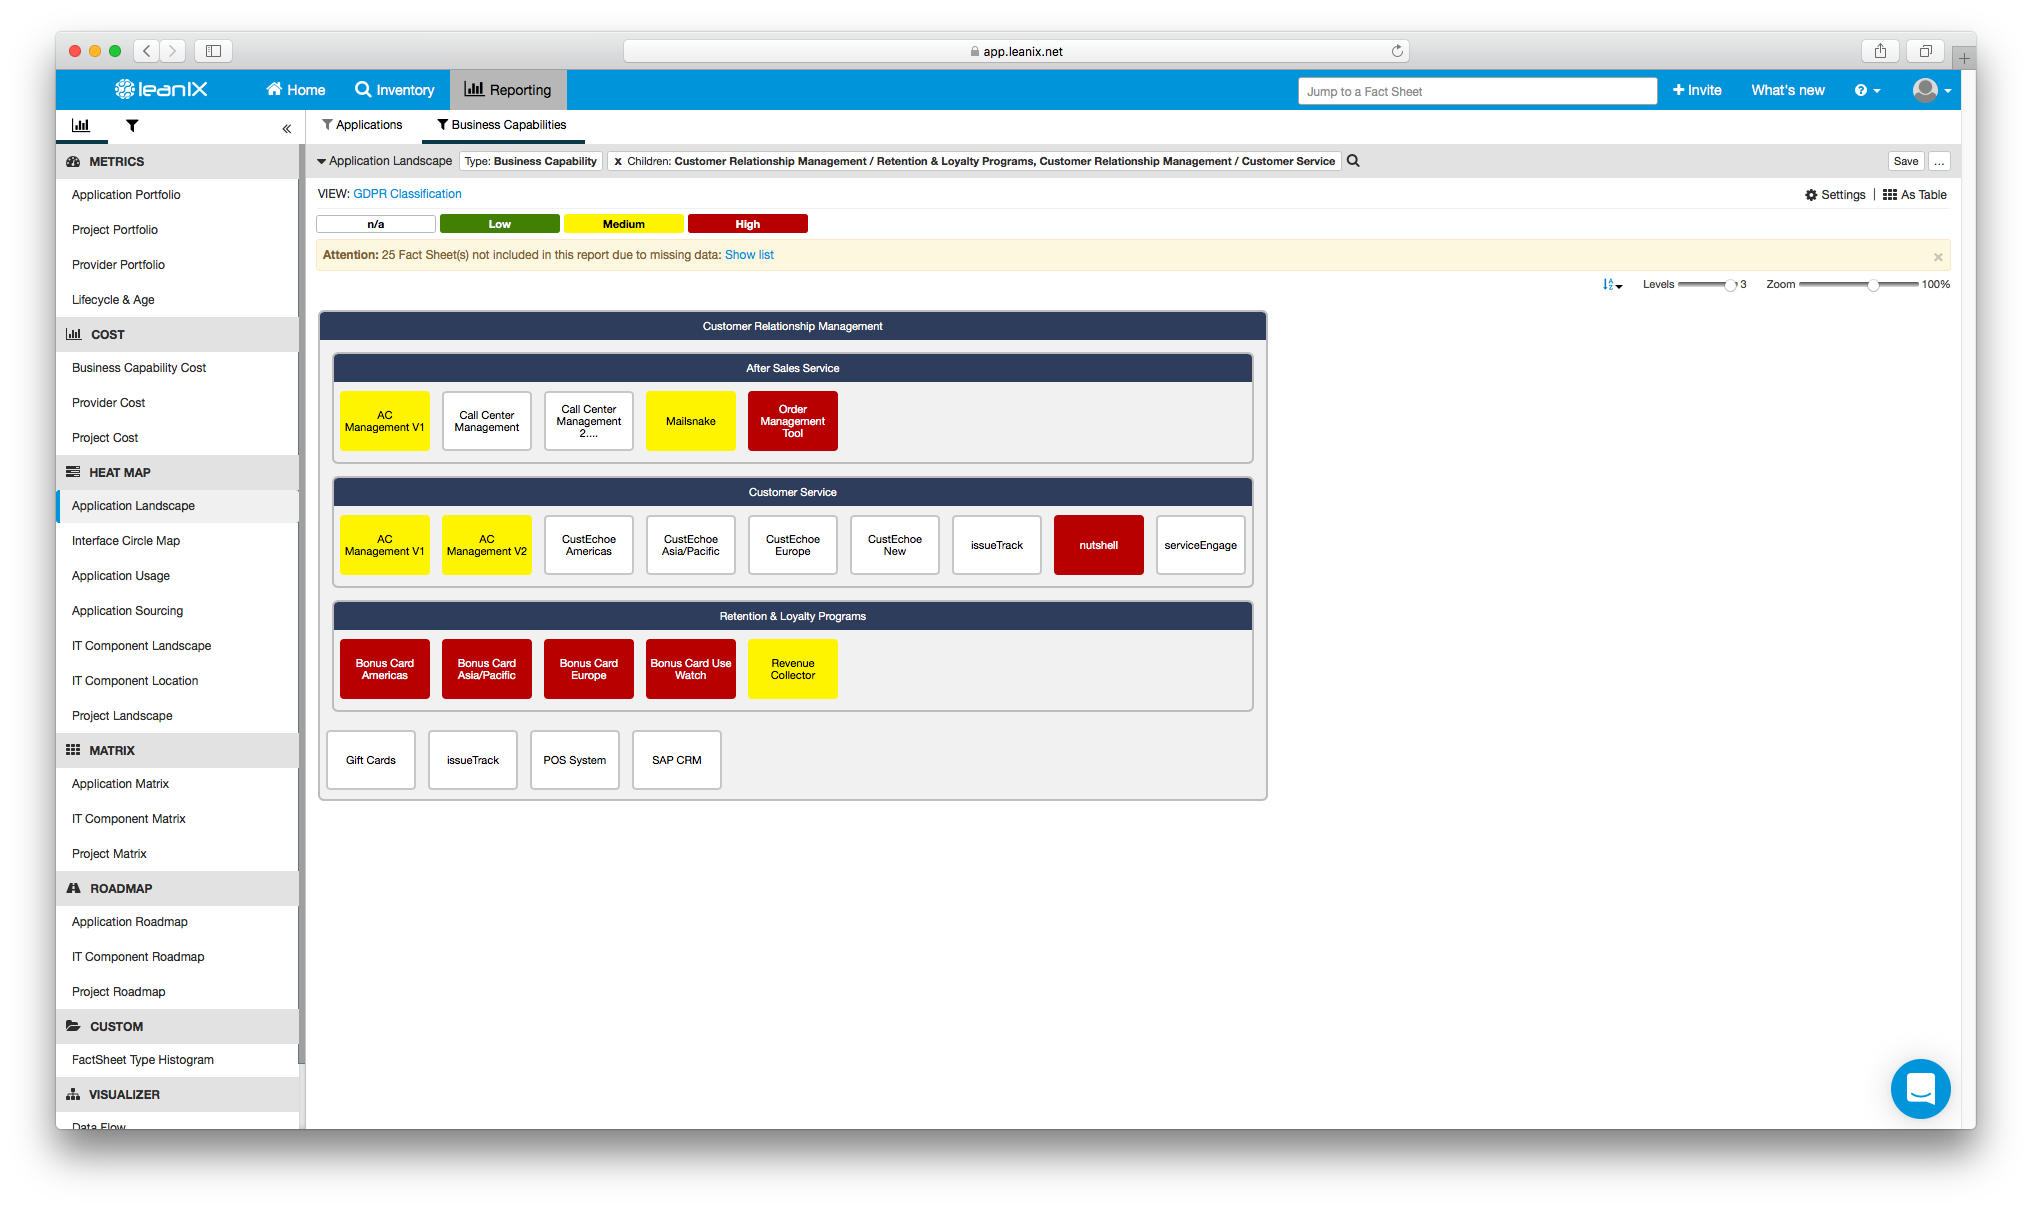
Image 14: A LeanIX Application Landscape view set to Customer Service Business Capabilities and viewed for GDPR importance.
6. Solution Architect
Their role: To translate business requirements into a solutions architecture.
Their common questions: Help us identify all standard technologies to see if they can be integrated elsewhere in an existing landscape. Are these applications making us more efficient—and if so, in what other ways might our organization benefit from the technology? Can application response times be improved?
Your offer: An “IT Component Matrix” report offers Solution Architects the chance to gauge the value of IT Components in use across an operation. The report is laid out in ways to show which services from which vendors are powering (or aren't...) operations. The functional fit of each IT Component and its related level of business criticality can be tested to establish standards across regions or offices and thereby avoid redundant applications and technologies.
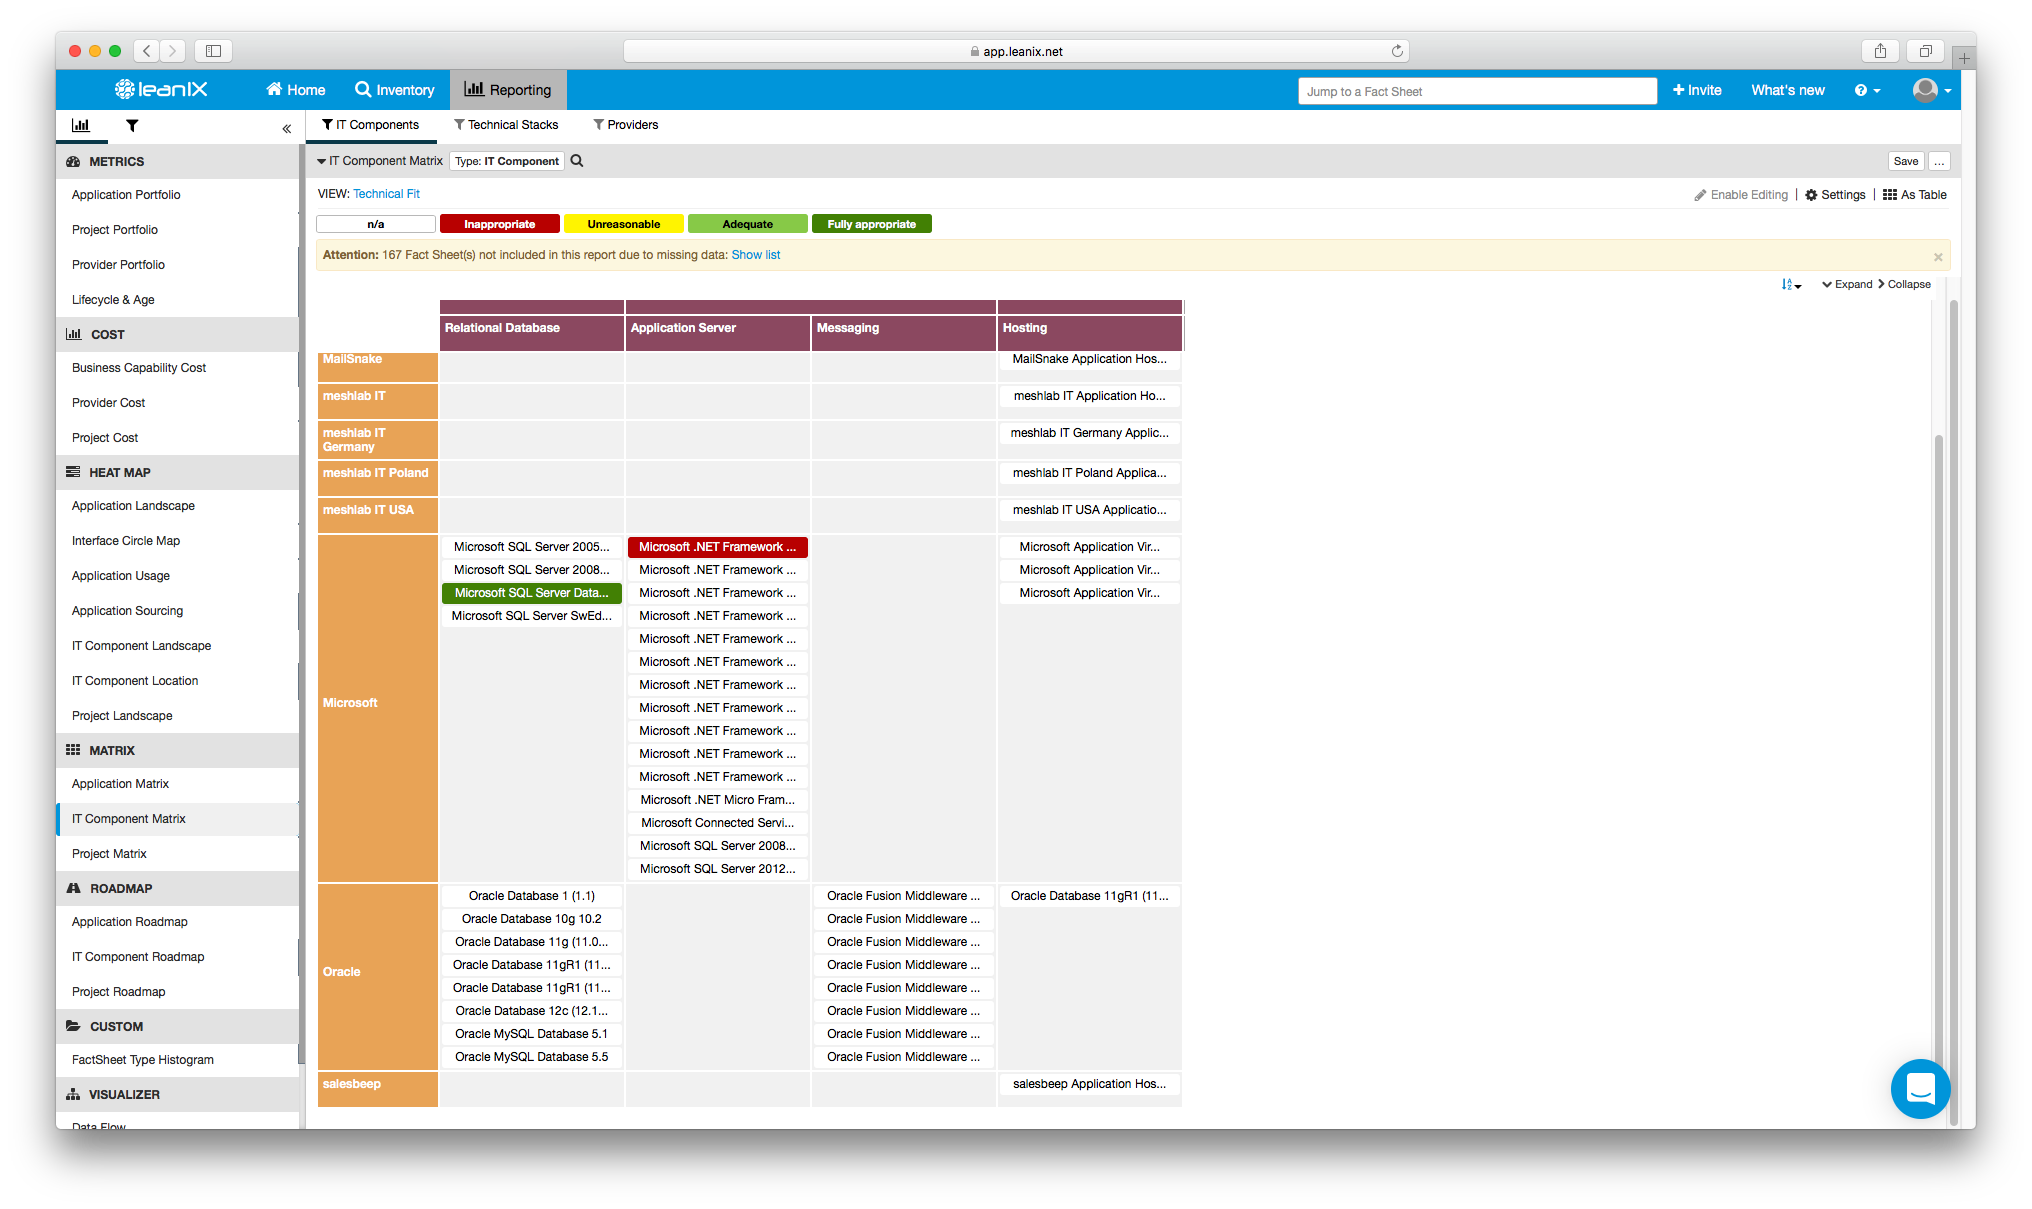
Image 15: An IT Component Matrix report within LeanIX showing the "Technical Fit" of IT Components.
After showing the stakeholder(s) how to generate visual representations of the relationships between technologies with the Data Flow tool, carry onwards to a demonstration of the “Metrics” read-outs embedded to every LeanIX IT Component Fact Sheet—specifically, the “Response Time” metric. The Response Time metric shows a technology’s average processing speeds by minute, day, month, and year.
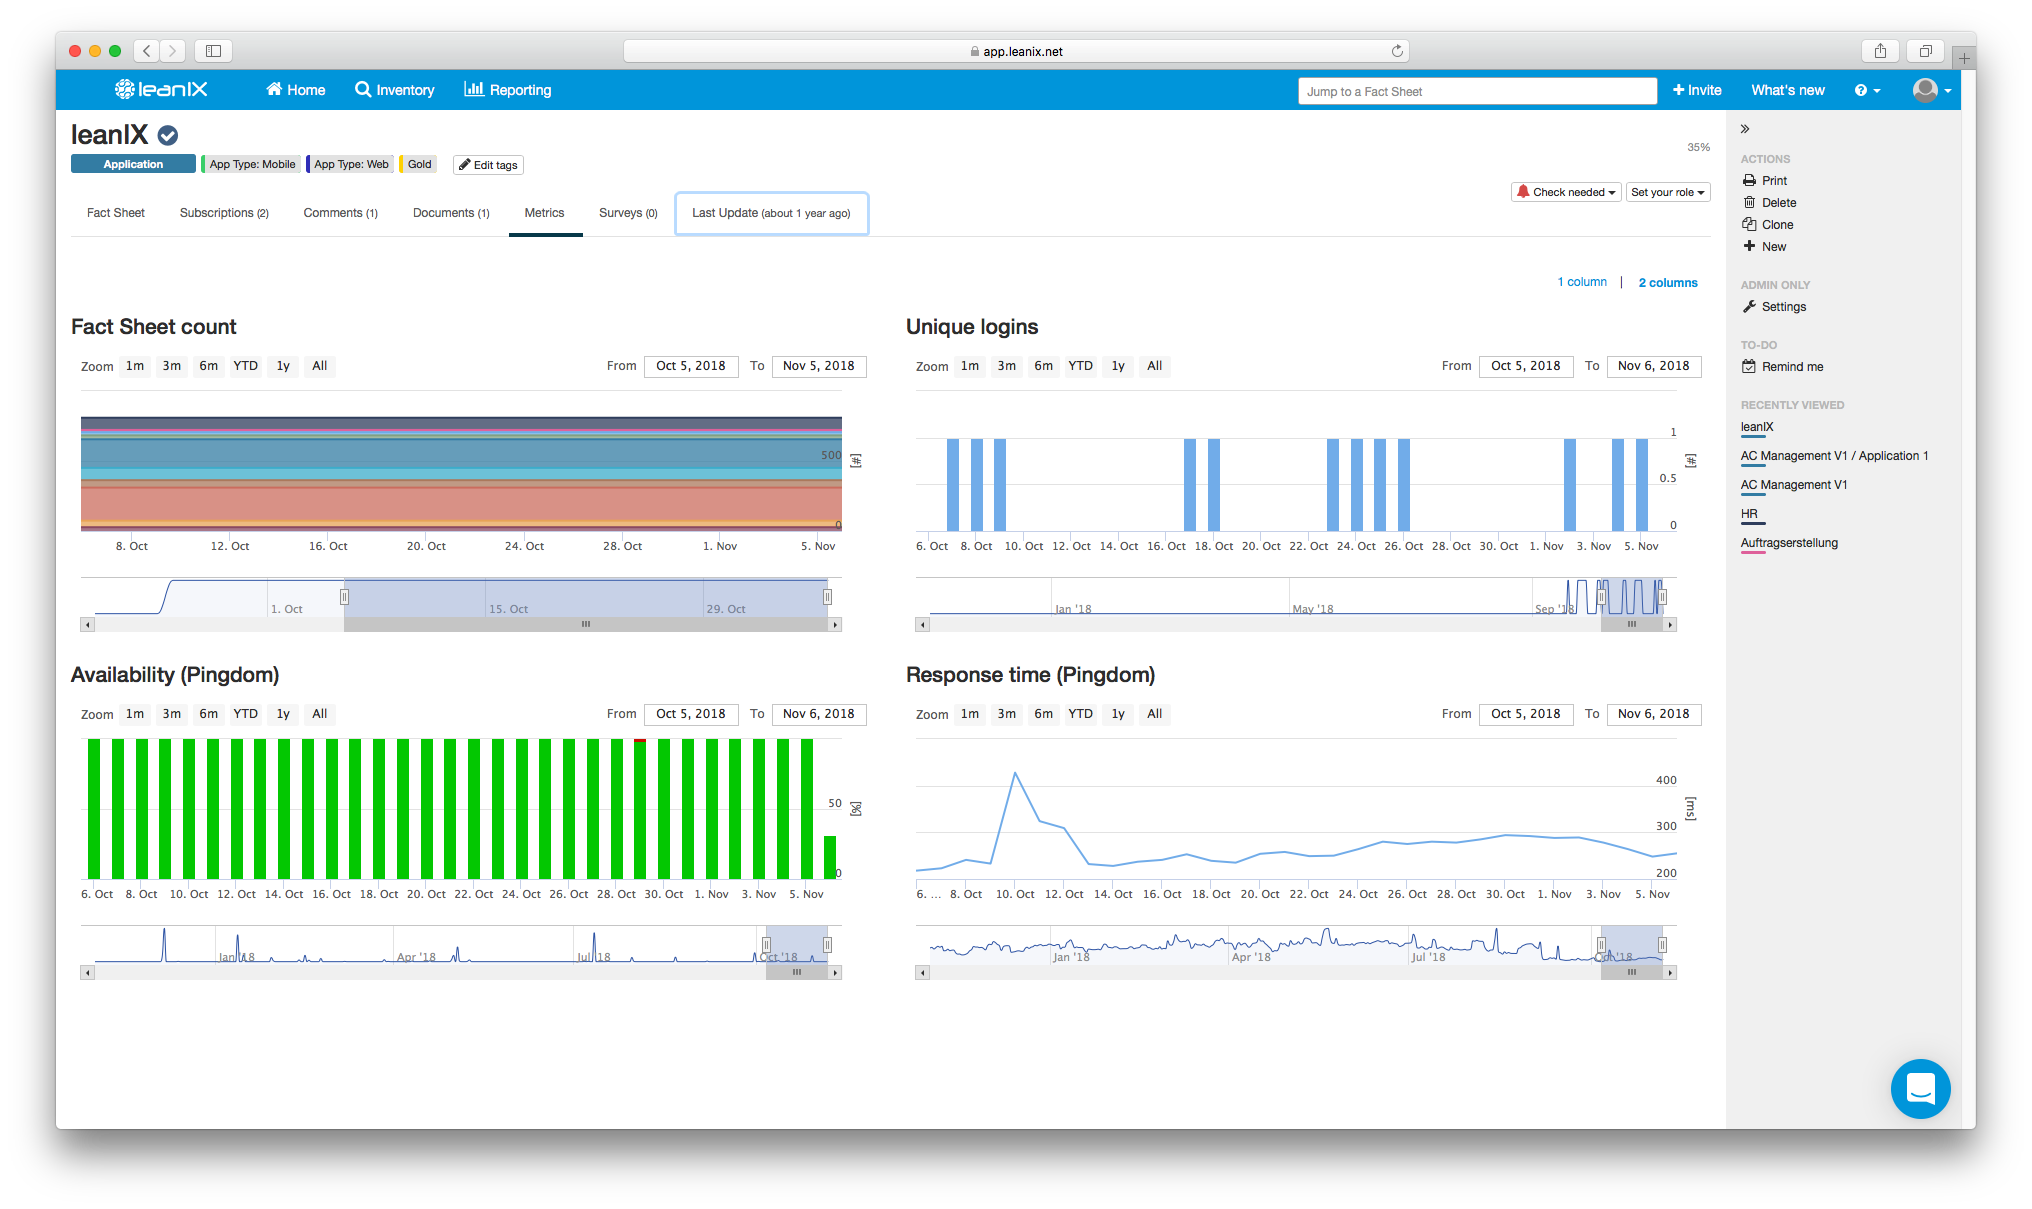
Image 16: The various metrics embedded to a LeanIX Application Fact Sheet. "Response Time" appears at the bottom right.
7. IT Program Management
Their role: To ensure the successful delivery of IT projects.
Their common questions: IT Program Managers want to know how any given project is altering applications. Is there a way for an EA Management Tool to show if an IT project’s budget is staying on track? And what is the project’s cost-effectiveness?
Your offer: For dramatic effect, take a moment to appear deeply contemplative. Emerge from thought with a twinkle in your eye, snap your fingers, and proudly guide the IT Program Manager to the “Project Roadmap”. Set this report’s “Drilldown” to show only applications, and let them see all affected applications while also simultaneously viewing the timelines of all past/present/future IT projects—all along with a horizontal, color-coded graph format just like the previously discussed Application Roadmap.
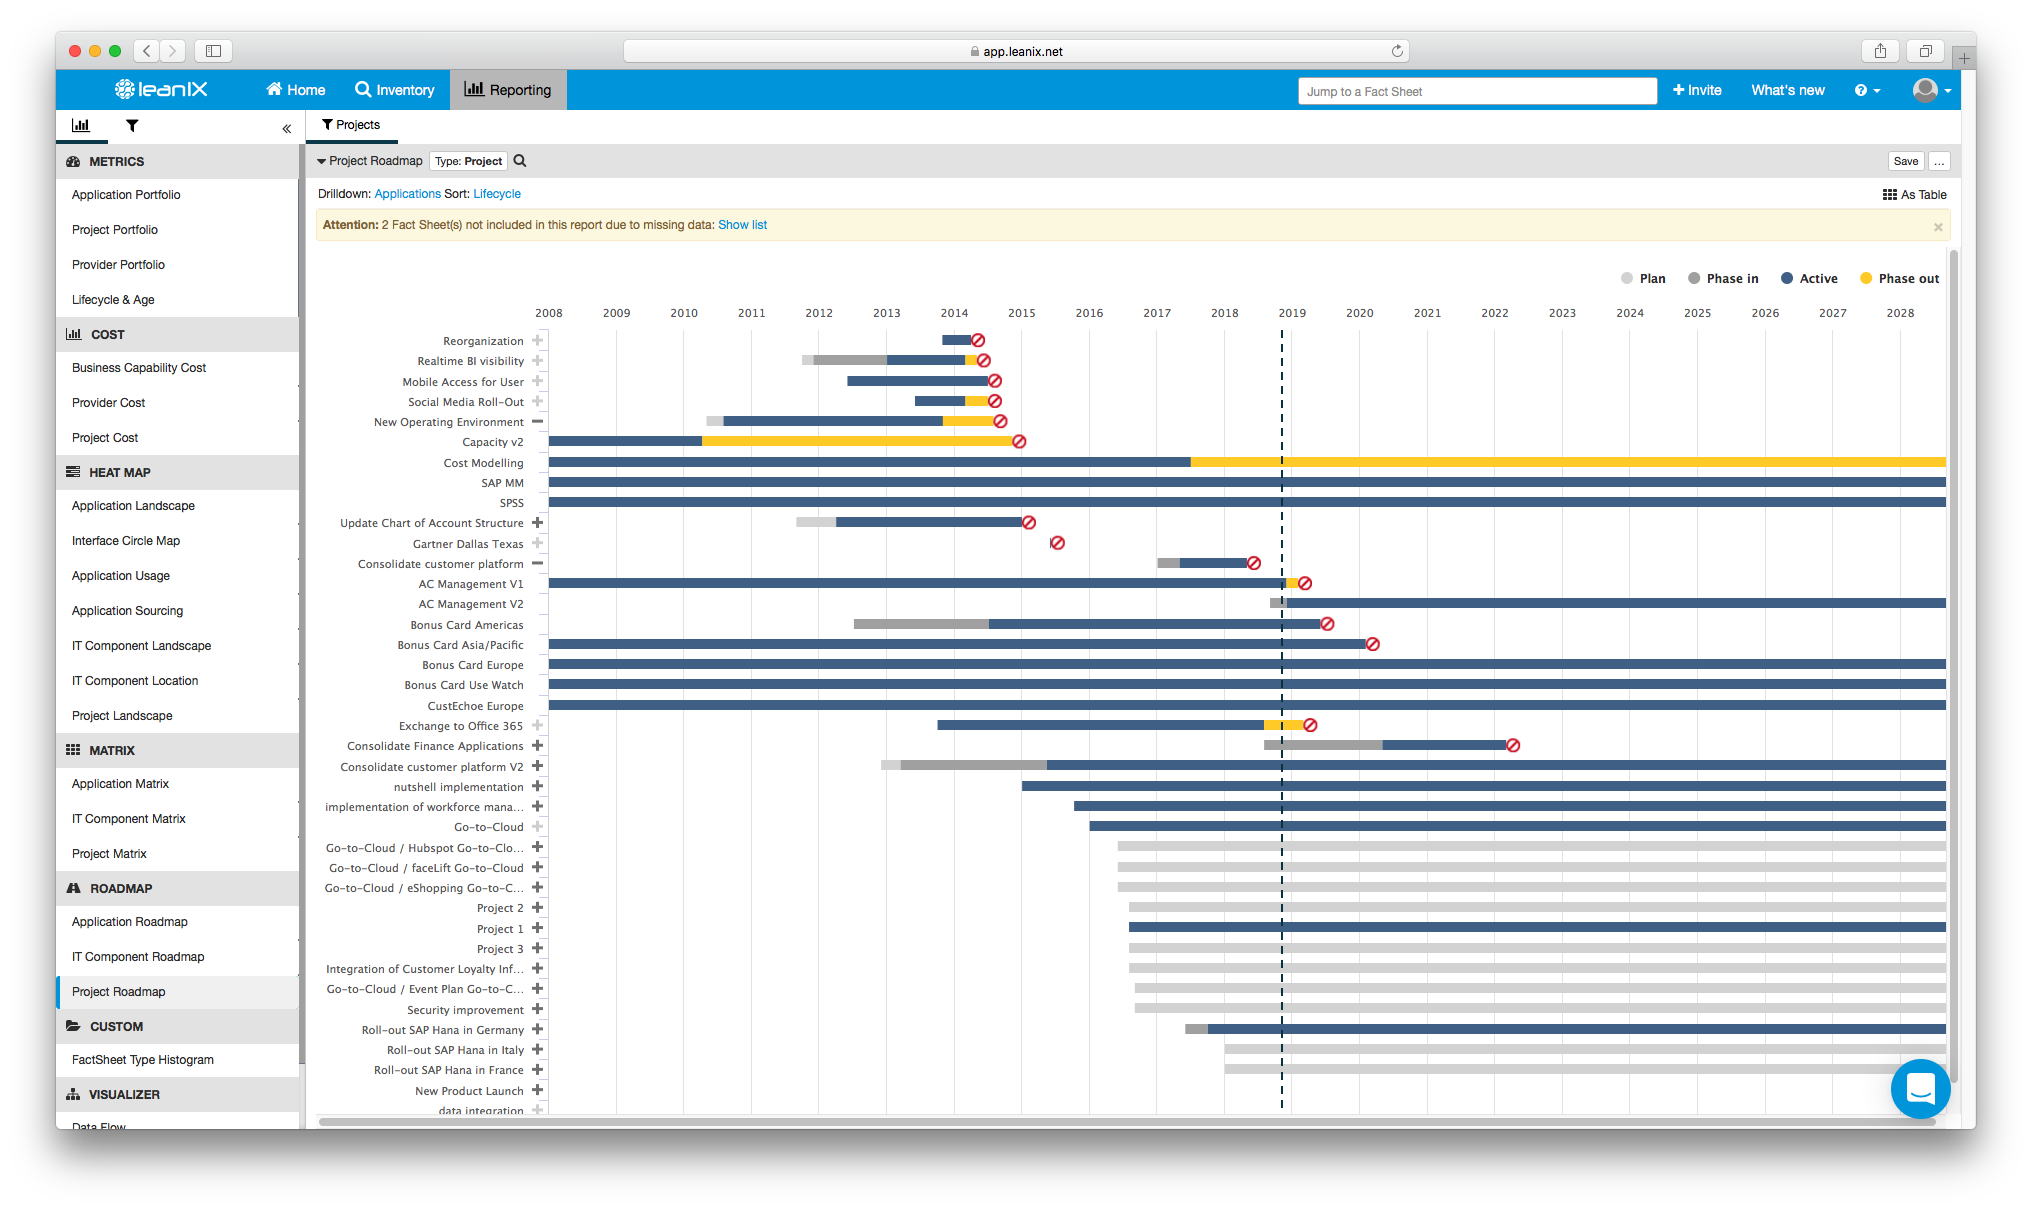
Image 17: A Project Roadmap, drilled down to Applications, in LeanIX.
Having suddenly acquired an insatiable thirst for top quality agile EA reporting views, take these drooling IT Program managers to the “Project Cost” area of LeanIX. Here they can receive a look at the Operational and Capital Expenditures of all running IT projects. This information can get filtered according to elements like Project Risk or Business Value, and the report itself can be seen within the browser or exported into XLSX or PDF format.
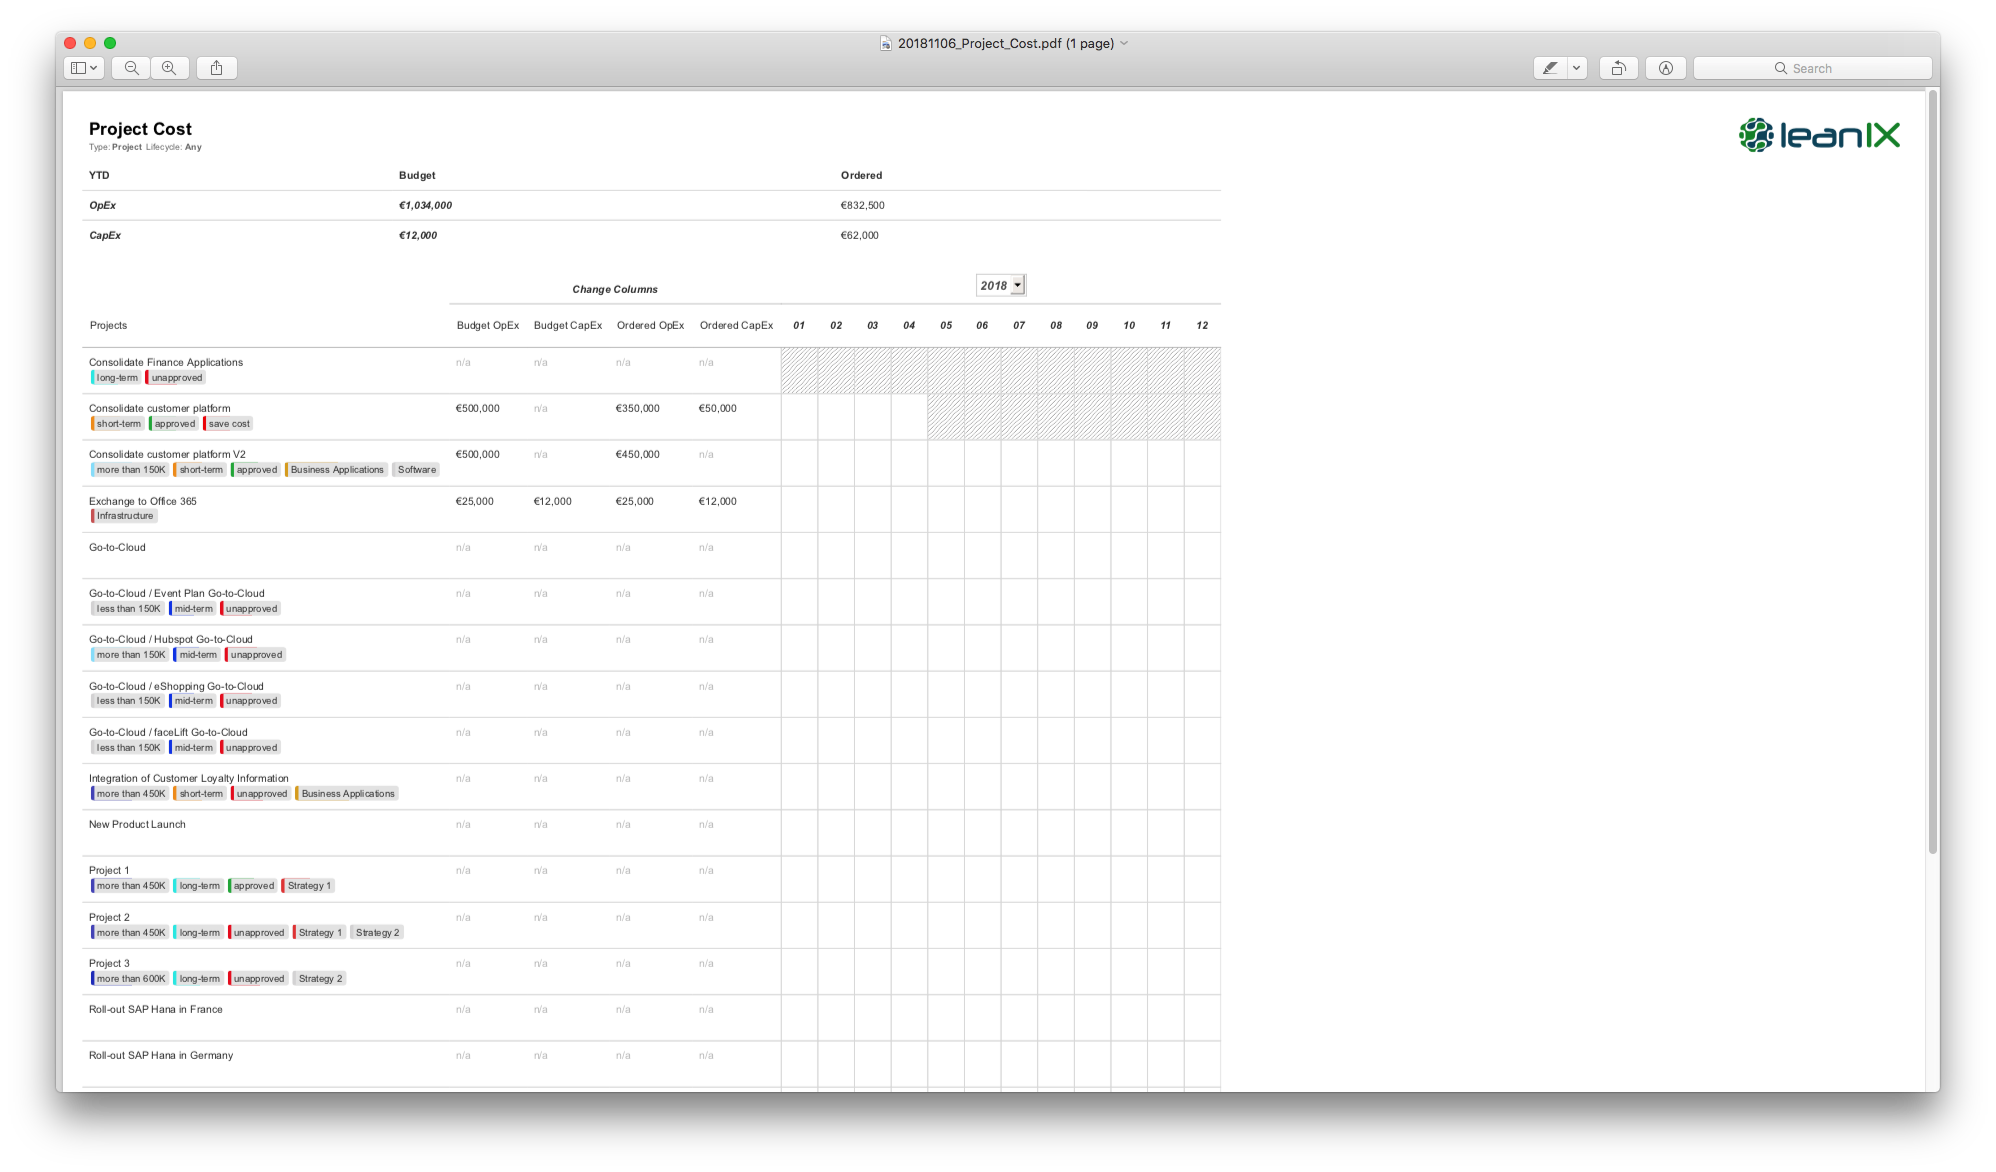
Image 18: A PDF report of a Project Cost Report as generated from LeanIX.
Cap off the whirlwind demonstration with a look at the “Project Portfolio” metric. Similar to the Application Portfolio metric, the effectiveness of all projects can be diagnosed in color-coded graphs—in this case, by “Project Value vs. Project Risk (Project Costs)” and “Project Value vs. Project Risk (NPV)”. For added benefit, filter down even further by a project’s level of risk, overall business value (marginal > significant), or lifecycle.
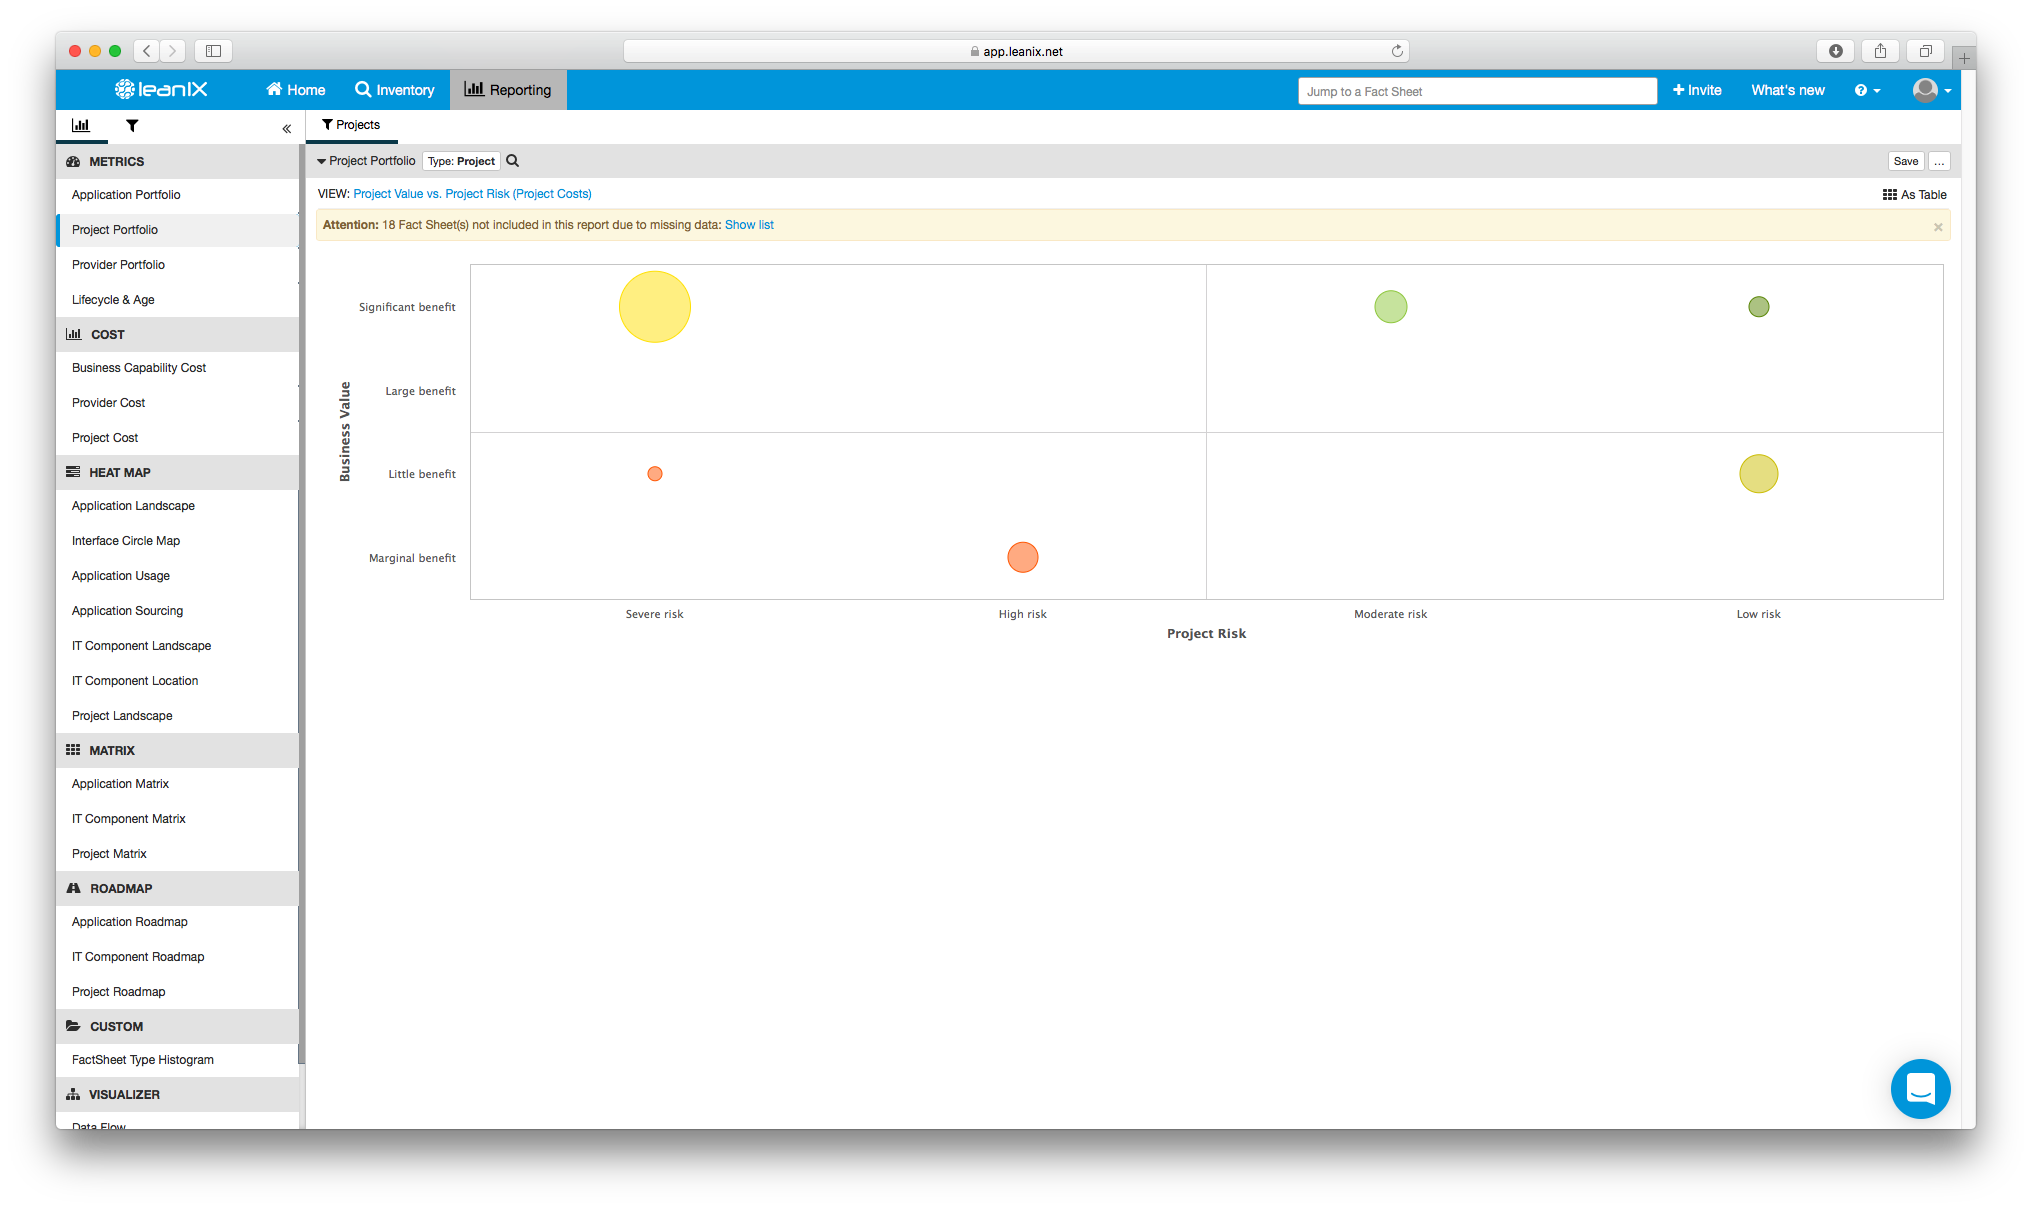
Image 19: An Application Portfolio metric in LeanIX according to "Project Value vs. Project Risk".
8. CTO
Their role: To define and implement technical strategies.
Their common questions: Where are we most at risk from technology obsolescence—is our application landscape being maintained and kept up to date? Precisely how do our IT landscape interfaces connect? Can you provide a technology roadmap?
Your offer: Commence an immediate summary of the Application Landscape tool. Focus specifically on how applications from the CTO’s IT landscape can be viewed from all operational hierarchies and business functions as based on either “Technical Fit” or “Lifecycle”. If an application is fading into obsolescence at any corner of your operation, this is where it will easily be spotted.
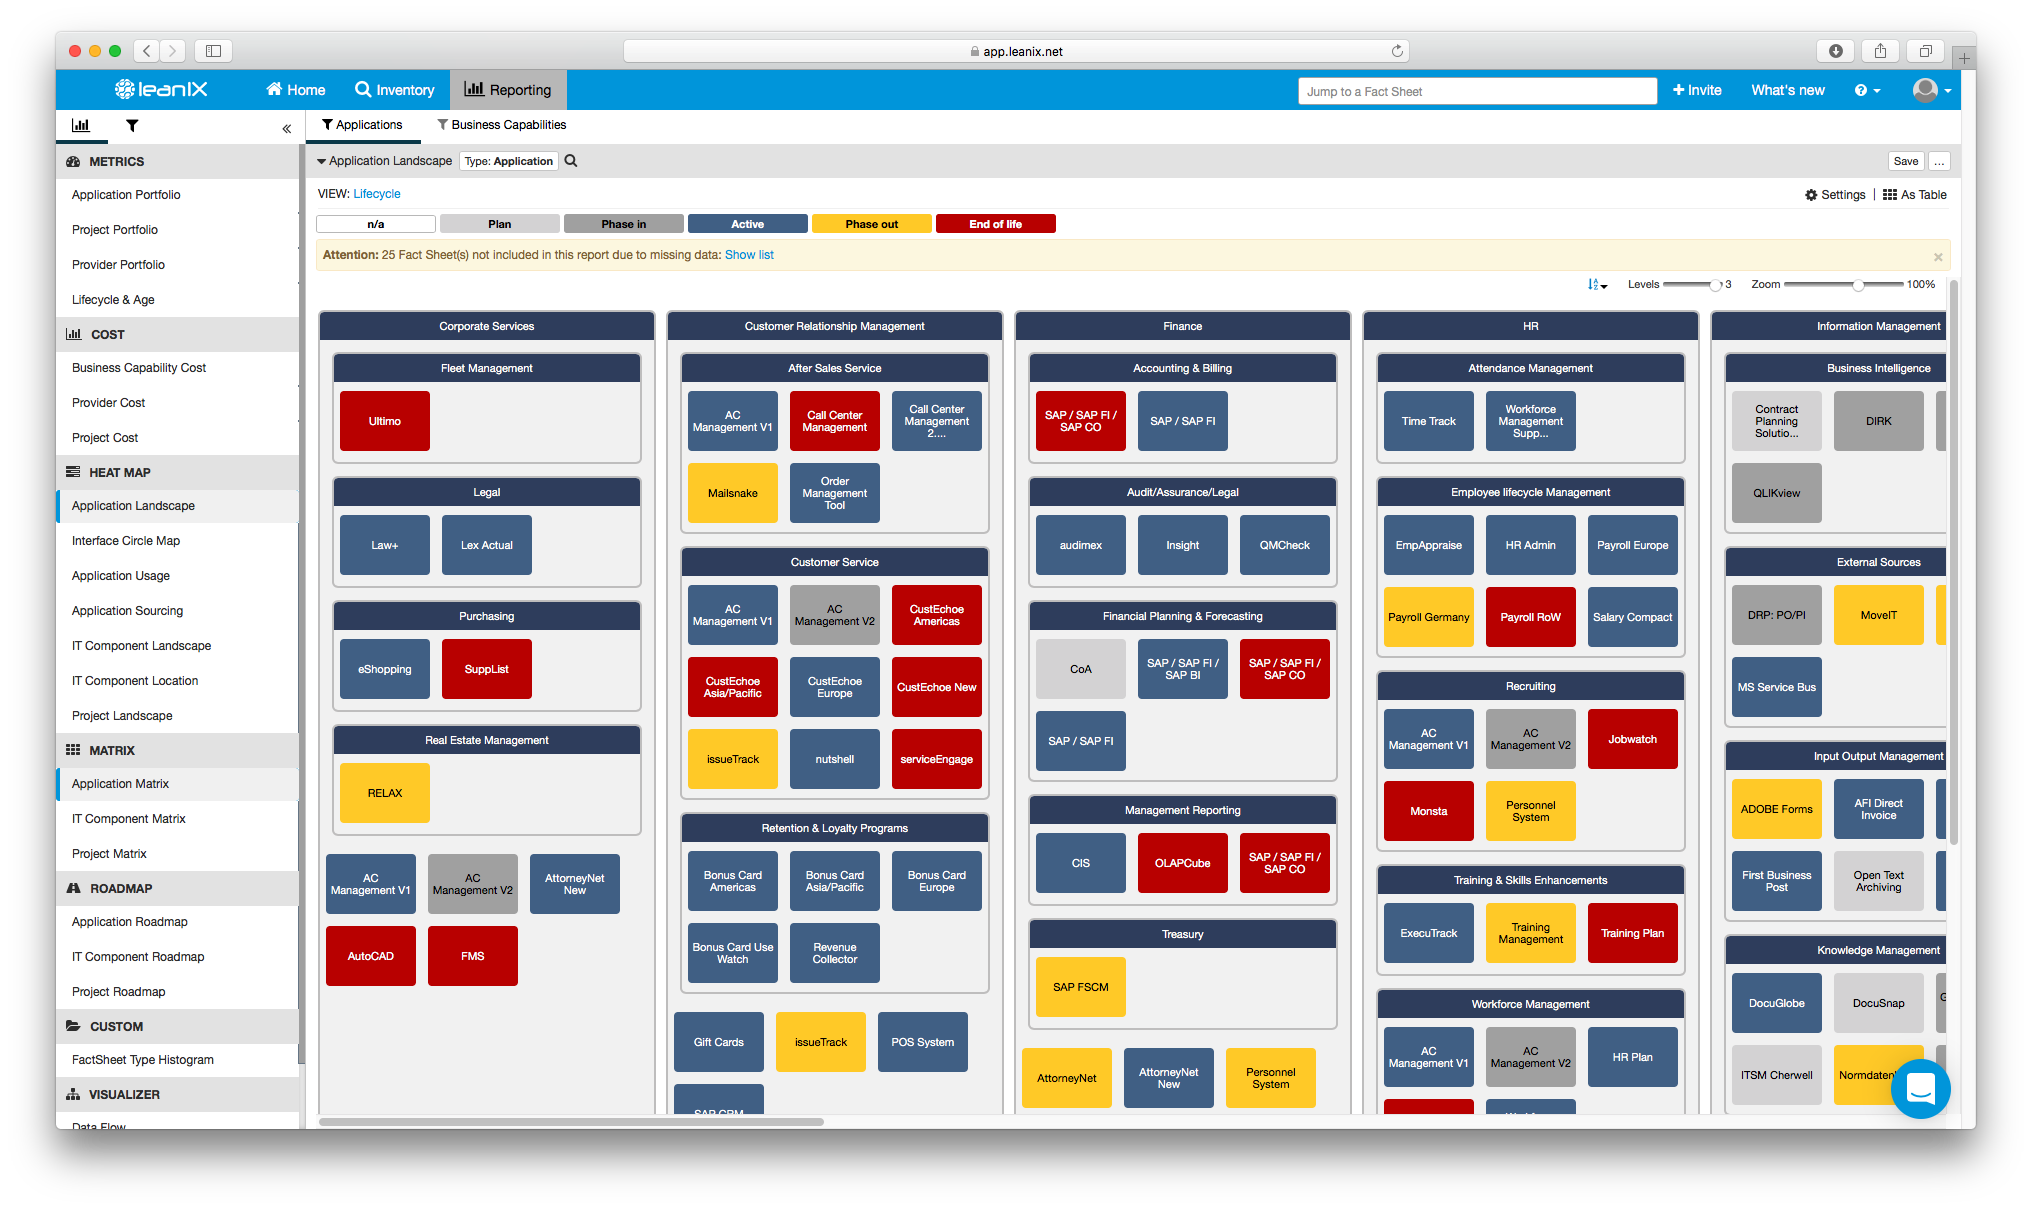
Image 20: An Application Landscape report showing the lifecycle of applications at various operational levels.
End your session on the IT Component Roadmap. This is where all evaluations of an enterprise’s technology can be made (and once again, in beautifully color-coded horizontal graphs) with clear views into the timelines of their license agreements, data quality, corresponding dependencies, and providers.
![The Enterprise Architect of Tomorrow [White Paper]: Practical insights on how to become data-driven, agile-minded, and forward thinking. »](https://no-cache.hubspot.com/cta/default/2570476/49fd1c31-67ad-464a-9aae-3ed5e866a24e.png)


